Floorplan Sound Simulation
See the sound before you install it.
A browser-based acoustic design tool for AV integrators. Upload a floor plan, trace the rooms, place speakers, and it predicts what every zone will actually sound like — SPL coverage across Low, Mid and High bands, room modes, first reflections and stereo imaging, with absorption set wall by wall and acoustic panels placed into the room, or the full Dolby reference geometry for a home cinema, checked speaker by speaker. Then it produces the paperwork: a report that adapts to whether the room is for music or cinema, a full bill of quantities, an Excel quotation that round-trips your prices, and a client-ready PDF. Cinema zones are checked against CEDIA/CTA RP22, printing whichever of its seventeen design checks apply, bass is solved at every seat with a multi-subwoofer advisor, and conference zones report STI speech intelligibility and microphone coverage. The design tool is free, with no account required.
Laid out like the app. Click a feature.
Twenty-One Guided Steps, No Manual
Floor plan to bill of quantities, no manual.
- Upload, trace, scale, tag the zone, seat, screen, speakers, cinema angles, amplification, furniture, room finish & walls, coverage, acoustics, RP22 check, bass & subwoofers, devices, rack, rack items, auto-wire, BOQ, share & export
- The rail runs in order — each step builds on the ones before it
- Every step autosaves in the browser, so a refresh loses nothing
A project is structured Floors → Zones — a whole villa, apartment or commercial fit-out in one file. Every floor gets its own plan image and scale; every zone gets its own SPL map, room modes, reflection analysis and speaker schedule. The bill of quantities and the PDF report roll every zone on every floor into one set of project-wide totals — not a single-room tool you have to run over and over.
Floor plan to priced proposal.
Sixteen steps, one tool.
Upload floor plan
PNG, JPG, WEBP or PDF. One plan per storey — the whole floor with all its rooms, not a single room.
Trace room outline
Click the corners to turn each room into a zone you design independently. Vertices stay editable afterwards.
Set scale
Click two points of a distance you already know — a wall length works best — and type it in. Everything downstream is real-world accurate.
Zone application
Tag the zone Music, Home Cinema, Conference or Outdoor. That one choice reshapes the analysis and the exported report.
Set seat
The main listening position and which way it faces — it wakes up first reflections, room modes and every cinema angle.
Set screen
Fixes the screen wall for cinema zones, so each angle is measured from the axis that actually matters rather than guessed.
Place speakers
Drag from the XSCACE catalogue — or any third-party product you add. Speakers snap to walls and rotate freely.
Cinema angles
Reference wedges for the front stage, surrounds and height layer, with channels auto-labelled FL, C, SR, TFL and the rest.
Amplification
Pick the streamer or processor and the amplifiers — more than one per zone where the design needs it.
Detect furniture
AI reads the plan and finds sofas, beds, wardrobes and rugs — they block and absorb sound in the simulation.
View coverage
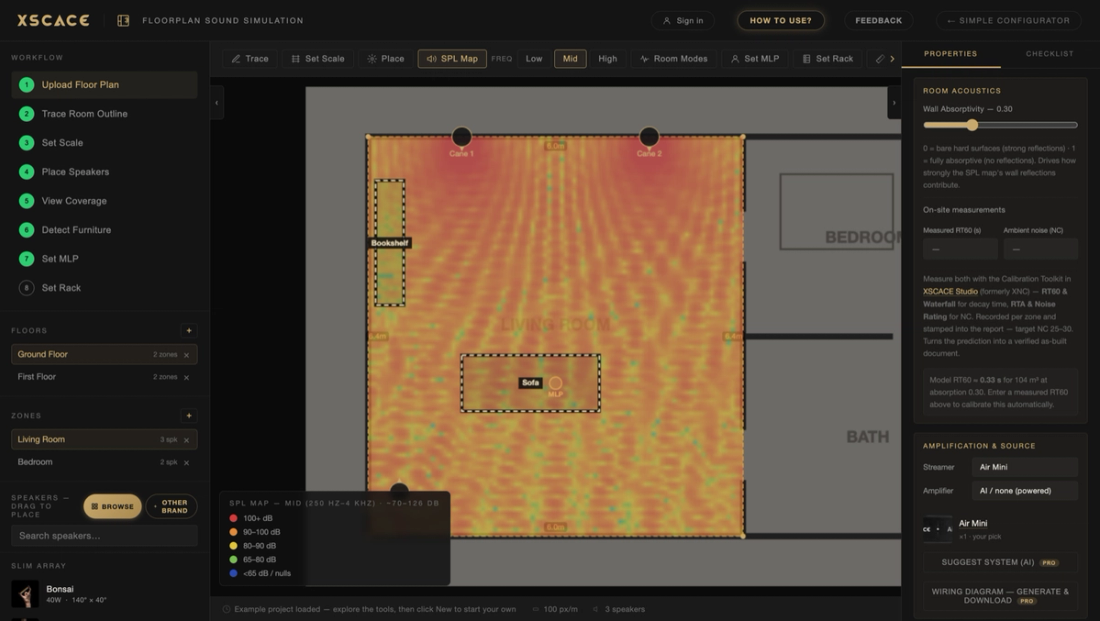
The SPL map — a calibrated heat map on an absolute dB scale, across Low, Mid and High bands.
Add devices
Sources and third-party equipment that belong in the rack and on the bill of quantities.
Set rack
The head-end location, from which every cable run is measured.
Edit rack items
Arrange what sits in the rack and how it is listed.
Auto-wire
The signal flow is drawn for you, from source through amplification to every speaker.
Edit BOQ
Unit prices, discounts, labour, tax and terms — the quotation, on the same screen as the design.
The cinema, checked row by row.
RP22 is the immersive audio design recommended practice CEDIA and the Consumer Technology Association publish jointly. It was the first to set objective performance criteria for home audio — figures you predict at design and verify before sign-off. Every cinema zone is measured against it, and the check is printed in the client report.
Layout, seat by seat
Front left and right at 22–30 degrees where the screen is wide enough — with a narrower screen they are expected at its edges, and the row states the screen size that would reach 22°. Wides 45–60, side surrounds 90–110, rear surrounds 135–150. Angles are judged at the main seat and shown as a range across the others; the surrounds get their own every-seat check for rooms with more than one row.
The height layer
Top-front 30–55 degrees, top-middle 65–100, top-rear 125–150 of elevation. Each height speaker is judged against the band it sits nearest to, so a four-speaker ceiling is checked speaker by speaker.
Headroom per channel
About 105 dB peak at every seat for each channel group — the 85 dB reference level plus 20 dB of headroom — reported at the worst seat rather than the average.
The subwoofer channel
About 115 dB at the seats: the same reference plus the 10 dB of LFE gain the format allows. Checked only when subwoofers and seats both exist.
Low-frequency design
Two or more subwoofers, and a predicted seat-to-seat spread of 6 dB or better across the seating area.
Noise and decay
NC 25 or better for background noise, roughly 0.2–0.45 seconds of mid-band reverberation, and first reflections treated on the side and front walls.
Aiming and clearance
Bed-layer speakers on axis to the seats within the greater of 30 degrees or a quarter of their dispersion, tweeters near ear height at 1.2 m, and about a metre of clearance between the rear seat and the back wall.
Acoustic transparency
Front speakers placed behind the picture are flagged as requiring an acoustically transparent screen; fronts beside the screen are judged on angle instead.
Three states, not a score
Every row reads met, needs review, or settled on site, with the reason and a suggested fix — so the report says where the architecture has already forced a compromise.
Bass at every seat, not just the best one.
One listening position hides the problem clients actually complain about. Below the room’s Schroeder frequency the field is a sparse comb of standing waves rather than a diffuse average, so the planner solves it as one — at every seat in the room.
Every mode, not just axial
Axial, tangential and oblique eigenmodes are solved to 200 Hz from the traced room, with rigid-wall cosine mode shapes and Kuttruff normalisation — the tangential and oblique modes most tools ignore are where the seat-to-seat differences actually come from.
Damped by what it touches
Each mode is given a bandwidth of 2.2 divided by RT60, then scaled by the absorption of the specific surfaces that mode engages. A panelled side wall damps a different set of modes than a bare one, and the model reflects that.
Real seats, not a point
Seat positions are taken from the sofas, chairs and beds drawn on the plan — one point every 0.6 m along each — or four virtual points around the listening position when no furniture has been placed.
The number that matters
Seat-to-seat spread across 20–120 Hz, against a 6 dB target. That is the figure the low-frequency chapter of RP22 is written around, and the one a client describes as the bass being fine in one seat and not the next.
Below the first mode
A pressure-zone term below the lowest mode, damped for leakage, so the prediction does not run away at the very bottom the way a pure modal sum would.
Nine arrangements, scored
Front-wall quarter points, side-wall midpoints, front and rear wall centres, four corners, four mid-walls, and wavefront rows of two or three a side — each solved at every seat rather than at the middle of the room.
The delayed, inverted rear row
A rear row delayed by the room depth divided by the speed of sound and reversed in polarity, so the rear wall reflection is cancelled as it arrives instead of summing into a null. Two or three units a side.
Spread before peak-to-dip
Layouts rank on seat-to-seat spread first and peak-to-dip second, because a peak shared by every seat can be equalised at commissioning and a difference between seats cannot.
Written as commissioning notes
Applying a layout places the subwoofers and stamps the delay in milliseconds and the polarity onto the rear units, so the decision reaches the processor rather than staying in a drawing.
Checked against the published practice.
Every design is measured against the references the industry already agrees on, and the report says row by row whether the room meets them, needs a look, or gets settled on site. The figures are applied as published; clause text is not reproduced.
CEDIA/CTA RP22
Channel angle bands, height bands, level and LFE headroom, multi-sub layouts and a design check of up to seventeen rows, printing only those that apply to the room.
CEDIA/CTA-CEB23
43° subtended angle for 2.35:1 widescreen film, about three picture heights.
THX
36° reference subtended angle at the primary seat.
SMPTE / ITU
30° minimum subtended angle — the floor below which the picture is too small for the room.
AVIXA DISCAS
Distance-to-image-height ratios: 4× analytical, 6× basic decision making, 8× passive viewing.
AVIXA A103.01
±3 dB uniformity target driving ceiling grid density and the pass/fail rows in the report.
Dolby reference layout
Front, wide, side and rear surround wedges, and the naming of every height channel.
IEC 60268-16
STI by the modulation-transfer method, with the published qualification bands from bad to excellent.
Eyring
RT60 from room volume and average absorption — chosen over Sabine because Sabine misbehaves in well-damped rooms.
Schroeder
The frequency below which the room is modal and above which it behaves diffusely.
The algorithms behind the numbers.
Standards say what a room should achieve. These are the methods used to predict whether it will — named, so the arithmetic can be checked rather than taken on trust.
Image-source model
First-order reflections are found by mirroring every source in each traced wall plus the floor and ceiling, and each image is validated against the real wall segment — so an L-shaped room behaves like one. Furniture contributes its own four faces.
Coherent phasor summation
Contributions add as complex phasors at the band centre rather than as energy, so the map shows the real comb filtering between two speakers instead of a smooth blob. Energy sum and an averaged mode are both available alongside it.
Eyring, not Sabine
RT60 from 0.161V divided by minus S times the natural log of one minus mean absorption. Eyring is used because Sabine overstates decay in well-damped rooms. The same equation inverts when a measured RT60 is typed in, backing out the absorption already in the room.
Kuttruff normalisation
Rigid-wall cosine mode shapes carrying Kuttruff's normalisation term, so modes on one, two or three axes take their correct relative weight in the sum rather than counting equally.
Convex hull rectangle
Modal analysis needs a rectangle, so the traced polygon is reduced to its best-fit rectangle by convex hull — and the fill ratio is reported, so you can see how far the approximation has been stretched.
Houtgast and Steeneken
STI by the modulation-transfer method of IEC 60268-16, averaged across fourteen modulation frequencies from 0.63 to 12.5 Hz, with the apparent signal-to-noise clamped at plus or minus 15 dB.
Peutz
Articulation loss of consonants and the critical-distance term for n loudspeakers — the classic Peutz pair, reported alongside STI rather than instead of it.
ANSI S12.2 and Beranek
Background noise converts from an NC rating to dBA as NC plus 5, after Beranek, and that figure feeds the signal-to-noise term behind every intelligibility number.
Quarter-wave rule
Panel depth and air gap extend low-frequency absorption by the quarter-wave rule, and the library's per-band coefficients follow ASTM C423 style published data.
Marching cubes
The iso-surface shell is generated by marching cubes over a true volumetric SPL field, not extruded from the two-dimensional map underneath it.
ITU-R BS.2159
The multichannel loudspeaker placement reference sits behind the channel geometry alongside the Dolby reference layouts.
0.5 dB loss and HDBaseT
Wire gauge is chosen from a half-decibel loss limit by run length and load impedance, and any HDMI run past twelve metres is pulled as Cat with an extender pair, following HDBaseT practice.
Design it, then prove it.
A prediction is only as good as its assumptions. Measure the room on site with the Calibration Toolkit in the XSCACE Studio — a real RT60 and ambient noise (NC) reading — and enter it into the planner. The measured RT60 is mathematically inverted into the room’s true average absorption, which then re-drives the whole simulation.
Get your team trained on Floorplan Sound Simulation.
A live, hands-on session for your design and sales team — floor plan import, speaker placement, SPL prediction, and exporting a client-ready proposal. Remote or in-person for qualified dealers.
Frequently asked questions16 answers
Is the Floorplan Sound Simulation free?
The design tool is free with no account required — simulation, room analysis, bill of quantities and Excel export all work signed out and autosave in your browser. XSCACE Pro adds unlimited branded PDF reports, the AI tools, saved price lists, cloud projects and third-party equipment.
How much does XSCACE Pro cost?
US$49.99 per user per month, billed in your local currency, after a 14-day free trial. Paying annually gives two months free — $499 a year. Active XSCACE dealers get Pro at no cost.
What do I get on the free tier?
Multi-floor simulation, room modes, the 3D view, the full bill of quantities with Excel export, signal-flow diagrams, the commissioning checklist, and rack layout with cable estimation. Free includes 3 client PDF reports a month and 25 AI requests (8 if you are signed out).
Do I need an account?
Not to design. Simulation, room analysis, BOQ and Excel export all run signed out and autosave in the browser. An account is needed for cloud projects, saved price lists, your branding on reports, and the AI features.
What happens when the Pro trial ends?
Nothing is deleted. Your projects and price lists stay, the Pro features pause, and the free tool keeps working exactly as before.
Can I use other manufacturers’ speakers?
Yes, with Pro. Add any product manually, or upload its spec sheet and let the AI extract the sensitivity, power and dispersion the simulation needs. Added products join a shared community catalogue.
Can I simulate a whole house, not just one room?
Yes. Projects are structured Floors → Zones, so a whole villa or multi-room fit-out is one project. Each floor has its own plan and scale, each zone its own SPL map and speaker schedule, and the BOQ and PDF report roll every zone on every floor into project-wide totals.
What acoustic analysis does it actually do?
SPL coverage prediction across Low (20–250Hz), Mid (250Hz–4kHz) and High (4–20kHz) bands using coherent phasor summation, axial room modes with boom and null flagged at the listening position, first-reflection points on each wall, L/R stereo imaging angle checked against the 45–60° target, and modelled RT60 for the room volume and absorption.
Is there a 3D view?
Yes. Coverage renders as a relief surface whose height encodes level, with speaker dispersion cones, adjustable room and listening height, a first-person walk mode, and GLB export for use in other 3D software.
How do I create an audio BOQ automatically?
Place speakers on the plan and the tool tracks every product and quantity per zone as you design, adding rack layout and cable lengths from where you place the rack. Export rolls the whole project into one bill of quantities, an Excel quotation that round-trips your prices, and a client PDF report — with no manual line-item entry.
Can I put my own prices and currency on it?
With Pro, yes. Save your standard unit prices once and they apply to every project in any of twelve currencies, shown on the BOQ, the report and the spreadsheet. AI price-list import can read a distributor PDF or Excel straight into matched prices.
Does it work offline?
Simulation and exports run in the browser once the page has loaded. The AI features, account, cloud projects and payments need a connection.
Is it a desktop-only tool?
Effectively yes. Tracing rooms and placing speakers precisely needs a mouse and a wide screen, so phones and tablets get a "best on desktop" notice rather than a cut-down editor.
Does the prediction replace on-site measurement?
No, and it does not claim to. It is a prediction that becomes a verified as-built document once you enter a real RT60 and NC measurement taken on site with the Calibration Toolkit in XSCACE Studio — the measurement mathematically re-drives the simulation.
What is sound simulation software used for?
It predicts how a speaker system will perform in a space — coverage, SPL, room modes and reflections — before anything is installed, so an integrator catches bass problems, dead zones and comb filtering on screen rather than on site after the drywall is closed.
How is this different from REW or Yamaha’s speaker simulator?
REW is excellent at measurement but does no floor-plan design and generates no BOQ. Yamaha's Y-S3 simulates placement but only for Yamaha gear and produces no bill of quantities. This is the only free tool we know of combining acoustic simulation across a real product catalogue, room mode and reflection analysis, and automatic BOQ, quotation and PDF report generation in one workflow.
Used as a speaker placement calculator it works out how many speakers a room needs and where they go. As a coverage calculator it predicts SPL across the floor at listening height, so dead spots show up on the drawing rather than on site. As a ceiling speaker calculator it checks spacing against the coverage angle and the ceiling height. It also lists the room’s axial modes from the traced dimensions, and checks Dolby reference angles against the seating position.
For a single rectangular room, the speaker placement calculator and subwoofer placement calculator do the same arithmetic on their own.
Each wall is built layer by layer — fabric over mineral wool, drywall over an insulated cavity, slatted timber over polyester — with its real thickness, and room finish is set per band rather than as one figure for the room. Acoustic panels can be placed into the plan so the coverage map recomputes around the treatment. Enter a measured RT60 and ambient noise reading after commissioning and the same model re-solves against what the finished room actually did.
These are the brands other users have already added. It is not a closed list: any manufacturer’s product can be added by typing its specifications or uploading the spec sheet, and it joins the shared catalogue once moderated.
The catalogue carries XSCACE, soundbars and their companion subwoofers, and other manufacturers’ products, filterable by brand. Modelling other manufacturers’ products is included with Pro; everything else in the planner is free to use.