Contents27 sections
An AV integrator does not get paid for a prediction. You get paid for a number a client will sign, a system that behaves the way you said it would, and paperwork the installer can work from. The XSCACE Floorplan Sound Simulation exists to compress the distance between those three things: upload a floor plan, trace the rooms, place speakers, and it predicts coverage, room modes, reflections and stereo imaging — then turns that same design into a bill of quantities and a branded client report. The design tool is free and needs no account.
Who This Is For
This is a tool for the person who has to produce a number. Custom-install integrators quoting residential and light-commercial audio, AV consultants who need coverage evidence to defend a specification, and dealers designing around a catalogue they already know. If your week contains the sentence "how many speakers does this room need, and can you prove it by Friday", this is aimed at you.
It is deliberately a desktop tool. Tracing a room outline and placing speakers to the centimetre needs a mouse and a wide screen, so phones and tablets get a "best on desktop" notice rather than a cut-down editor that would produce sloppy geometry.
The Twenty-One-Step Workflow
The tool is built as a guided sequence rather than a blank canvas, and the order matters because each step depends on the ones before it — a distance means nothing until the scale is set, and the reflection tools stay asleep until the listening position exists. You can move between steps freely; you just cannot usefully skip ahead. You do not have to finish a project in one sitting either — every step autosaves in the browser, so closing the tab or refreshing loses nothing.
The walkthrough below runs the whole sequence end to end, narrated, in under three minutes — from an empty canvas to an exported client proposal. Every step it shows is described in detail further down this page.
| Time | Step | What happens |
|---|---|---|
| 0:08 | Upload the floor plan | An image or a PDF of the whole floor — the drawing you were already sent |
| 0:16 | Trace rooms into zones | Click the corners, close the shape; the room gains dimensions and surfaces |
| 0:32 | Set the scale | One known distance calibrates every measurement that follows |
| 0:44 | Add another floor | Each floor carries its own zones inside one project |
| 0:52 | Place speakers | Dragged from the XSCACE catalogue, or a third-party product on Pro |
| 1:04 | SPL coverage map | Predicted level across the zone, in low, mid and high bands |
| 1:16 | Per-speaker SPL | The contribution of one speaker in isolation |
| 1:24 | Room modes | Axial resonances listed by frequency, before fit-out hides the structure |
| 1:32 | Reflections and 3D | First-reflection paths, furniture, and the SPL field as a relief surface |
| 1:48 | Dolby reference angles | The 5.1 layout checked against the standard from the seating position |
| 2:00 | Amplification and source | Streamer and amplifier assigned per zone |
| 2:08 | Zone application | Music and multiroom, or home cinema — which changes what the report calculates |
| 2:16 | Bill of quantities | Quantities fixed by the design, with labour, tax and terms |
| 2:32 | Client proposal | Coverage maps and a speaker schedule, exported to PDF and Excel |
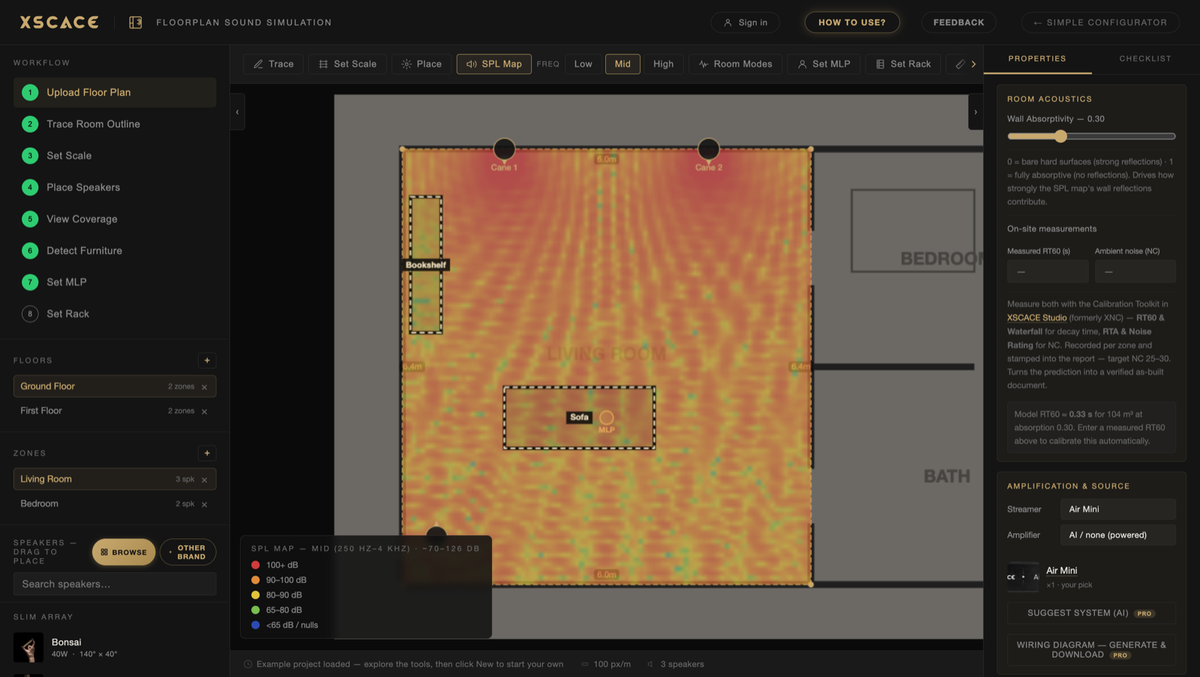
| Step | What you do | What it enables |
|---|---|---|
| 1 · Upload floor plan | Drop in a PDF or image of the plan | Everything else is traced on top of it |
| 2 · Trace room outline | Click the walls; multi-room and multi-floor | Room geometry for modes and reflections |
| 3 · Set scale | Draw one known dimension | Every prediction becomes real metres |
| 4 · Place speakers | Drag from the catalogue onto the plan | SPL prediction and the bill of quantities |
| 5 · View coverage | Switch between Low, Mid and High bands | See where bass builds and top end thins |
| 6 · Detect furniture | AI reads the plan for occlusion and absorption | More realistic absorption in the model |
| 7 · Set MLP | Mark the main listening position | Reflections, imaging angle and headroom |
| 8 · Set rack | Place the equipment rack | Cable-length estimation into the BOQ |
Two of those steps are worth calling out. Setting the scale is what turns pixels into metres — without it every later number is meaningless, which is why it sits third rather than being optional. And setting the main listening position is the step that wakes up three separate tools at once: first reflections, the stereo imaging angle, and the headroom readout at the seat.
Real Interference, Not a Coverage Blob
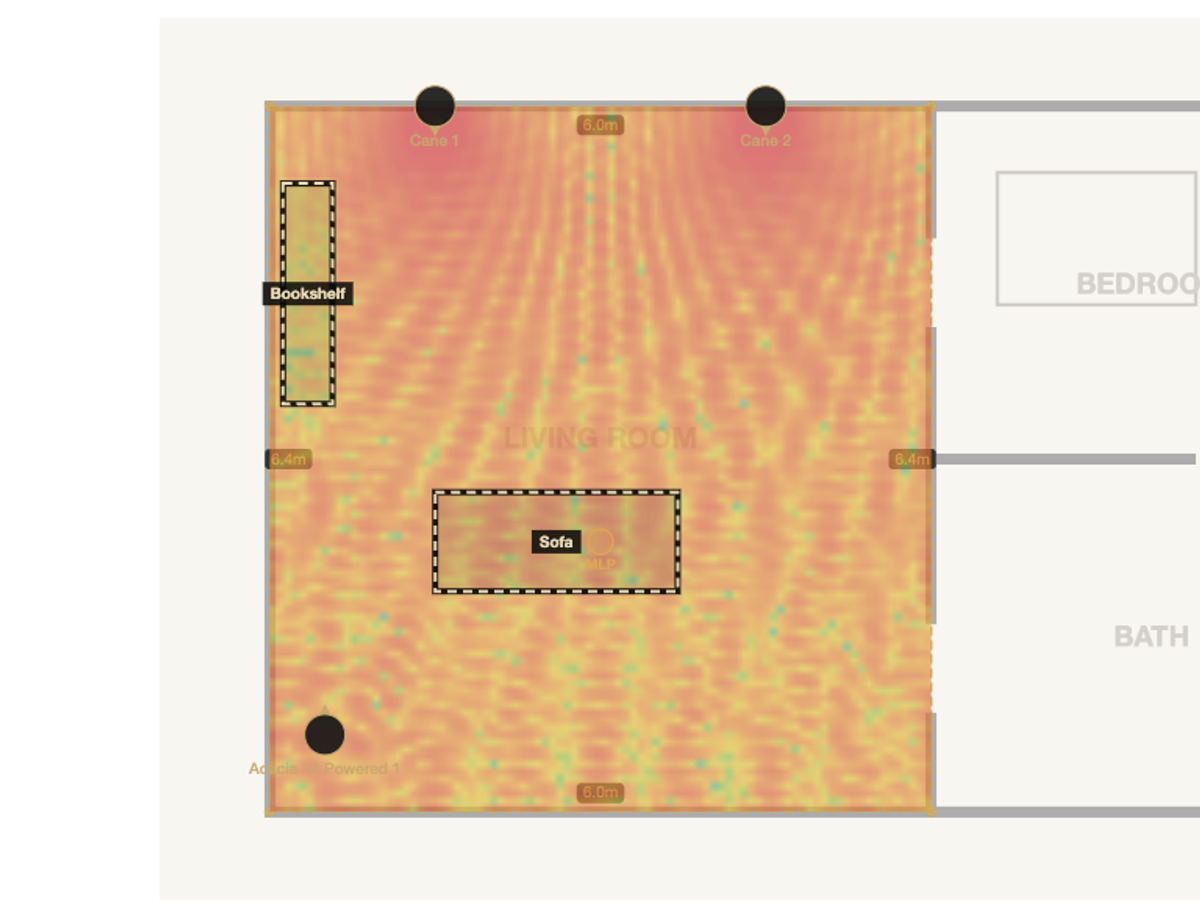
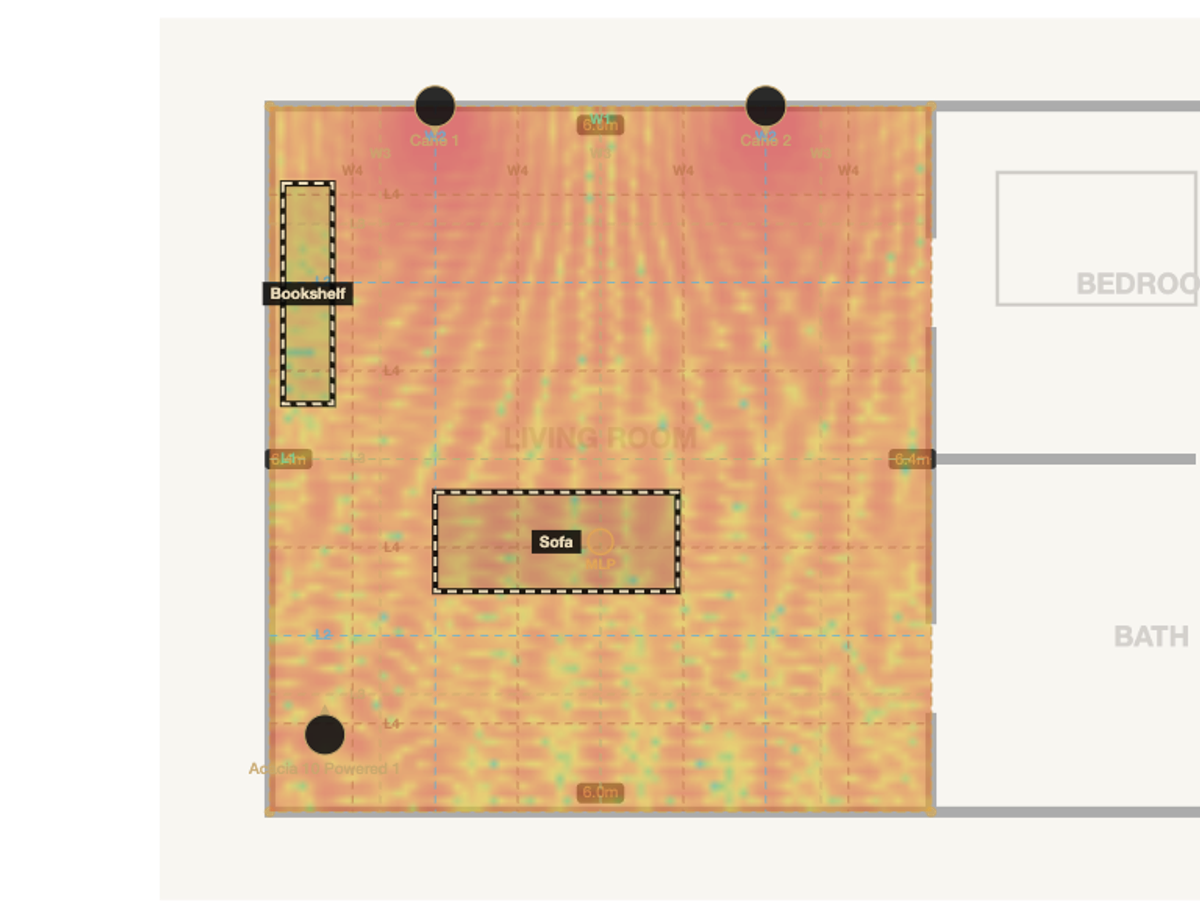
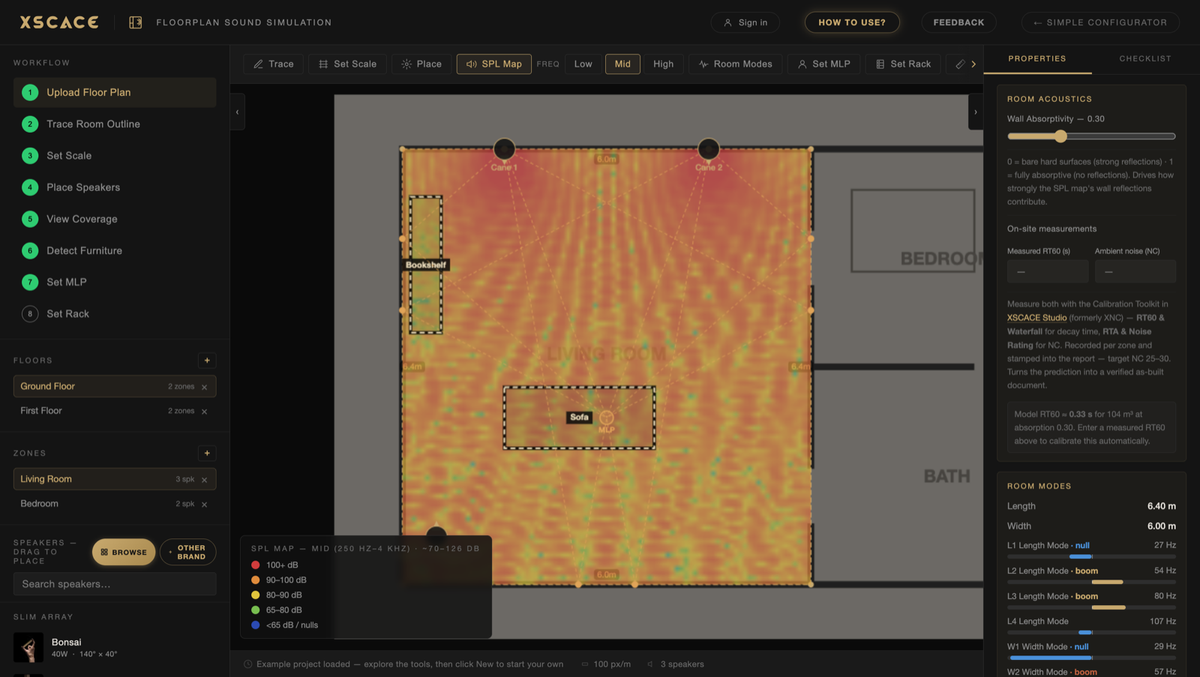
Most speaker-placement tools draw overlapping circles and call it coverage. XSCACE's engine uses coherent phasor summation — it models real interference between speakers, the same comb filtering and cancellation that happens in a physical room, rendered as a calibrated heat map with an absolute dB scale rather than a relative “good/bad” gradient.
The prediction accounts for each speaker's real sensitivity, power and horizontal/vertical directivity pulled from XSCACE's own product database, distance loss, mounting height relative to ear height, reflections off walls, floor and ceiling using the image-source method, and even furniture — objects absorb, reflect and cast acoustic shadows, weighted by frequency. The map renders across three bands: Low (20–250 Hz), Mid (250 Hz–4 kHz) and High (4–20 kHz), because a system that measures flat at 1 kHz can still have a dead zone in the bass.
Room Modes: Where the Bass Actually Booms
| Band | Range | What it reveals |
|---|---|---|
| Low | 20–250 Hz | Room-mode build-up, subwoofer coverage, where bass disappears |
| Mid | 250 Hz–4 kHz | Speech clarity and the body of music — the band coverage is usually judged on |
| High | 4–20 kHz | Directivity and beaming; where the top end thins away from the axis |
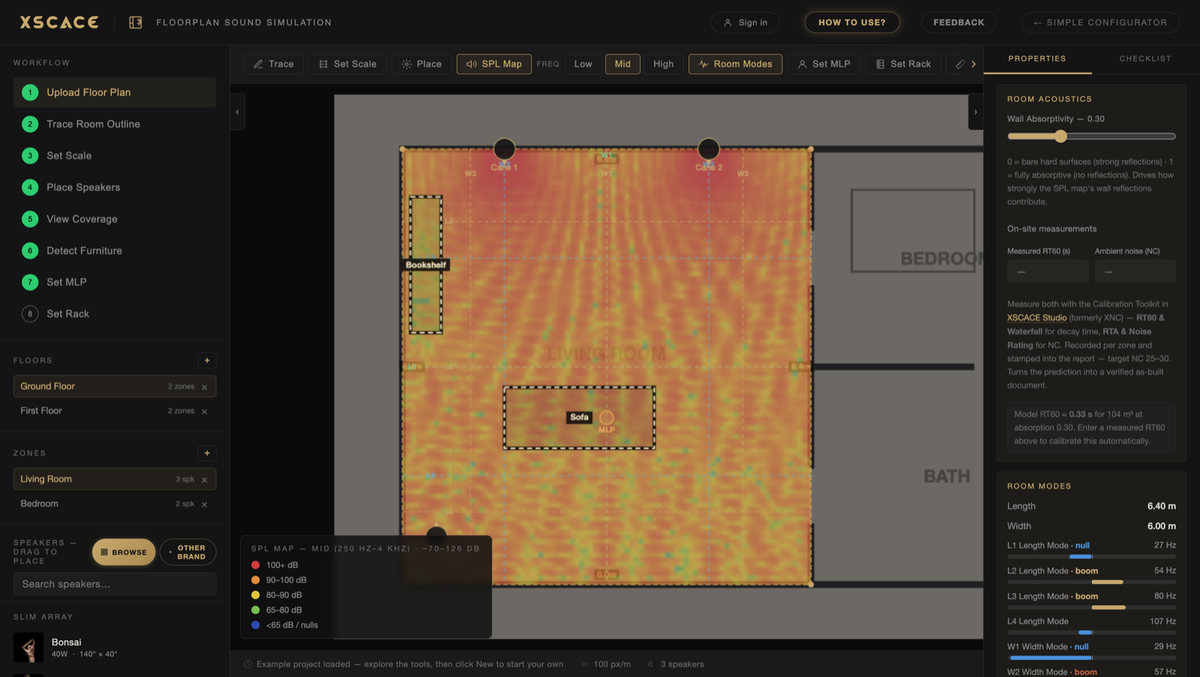
Every rectangular room has resonant frequencies determined by its dimensions — room modes — axial, tangential and oblique — that reinforce some frequencies and cancel others regardless of how good the speakers are. The tool calculates these on every axis, four orders deep, and draws both the peaks and the nulls as node lines directly on the plan. That is the difference between a subwoofer placement that sounds huge and one that sounds boomy in one corner and missing entirely six feet away. With the main listening position set, the same engine draws first-reflection points on the side walls — the exact spots where acoustic treatment actually does something, instead of a generic “add some panels” recommendation.
Bass Across the Seats, Not Just the Main One
A single listening position hides the problem that actually gets complained about. Below about 200 Hz the tool solves every axial, tangential and oblique mode at each seat — seats taken from the sofas, chairs and beds on the plan, one point every 0.6 metres, or four virtual points around the main seat when no furniture is drawn.
What it reports is the seat-to-seat spread over 20 to 120 Hz, against a 6 dB target. That is the number RP22's low-frequency chapter is about, and it is the one a client hears as “the bass is fine there but not here”. Each mode is damped by the absorption of the surfaces it actually touches, so a panelled wall damps a different set of modes than a bare one.
The multi-subwoofer advisor scores layouts against that number: front-wall quarter points, side-wall midpoints, front and rear centres, four corners, four mid-walls, and wavefront rows where a rear row is delayed by the room depth divided by the speed of sound and its polarity inverted. Layouts rank by spread first and peak-to-dip second, because a shared peak can be equalised and a seat-to-seat difference cannot. Applying one writes the delay and polarity onto the rear units as commissioning notes.
The mechanics, for anyone who wants them. Each eigenmode is found from the room dimensions as (c/2)·√((nx/Lx)² + (ny/Ly)² + (nz/Lz)²), with rigid-wall cosine mode shapes and Kuttruff normalisation, and the steady-state pressure at a seat is the sum of those modes over 20 to 200 Hz. Each mode gets a bandwidth of 2.2 divided by RT60, then scaled by the absorption of the surfaces that mode actually engages. Below the lowest mode a pressure-zone term takes over, damped for leakage, so the curve does not run away at the very bottom the way a pure modal sum would.
What the model deliberately leaves out is as important as what it includes: the subwoofers' own roll-off and output limits are not in it. This is the room's contribution to the response, not a prediction of what a particular subwoofer will do in it. Above the Schroeder frequency the same room stops being modal and starts behaving diffusely, which is why the modal model stops at 200 Hz and the broadband SPL map takes over.
Absorption, Wall by Wall
A room is rarely uniform. One elevation is glazed floor to ceiling, the one opposite is curtained, and the wall behind the seat is bookshelves — three surfaces that behave completely differently and, in most prediction tools, get averaged into one number for the whole room.
Each wall is now built layer by layer — fabric over mineral wool, drywall over an insulated cavity, slatted timber over polyester — with its real thickness, and room finish is set per band rather than as one figure. That matters most in exactly the rooms architectural speakers get specified into — the marble, glass and stone interiors where a single room-average figure is furthest from the truth, and where the difference between a curtain open and closed is audible.
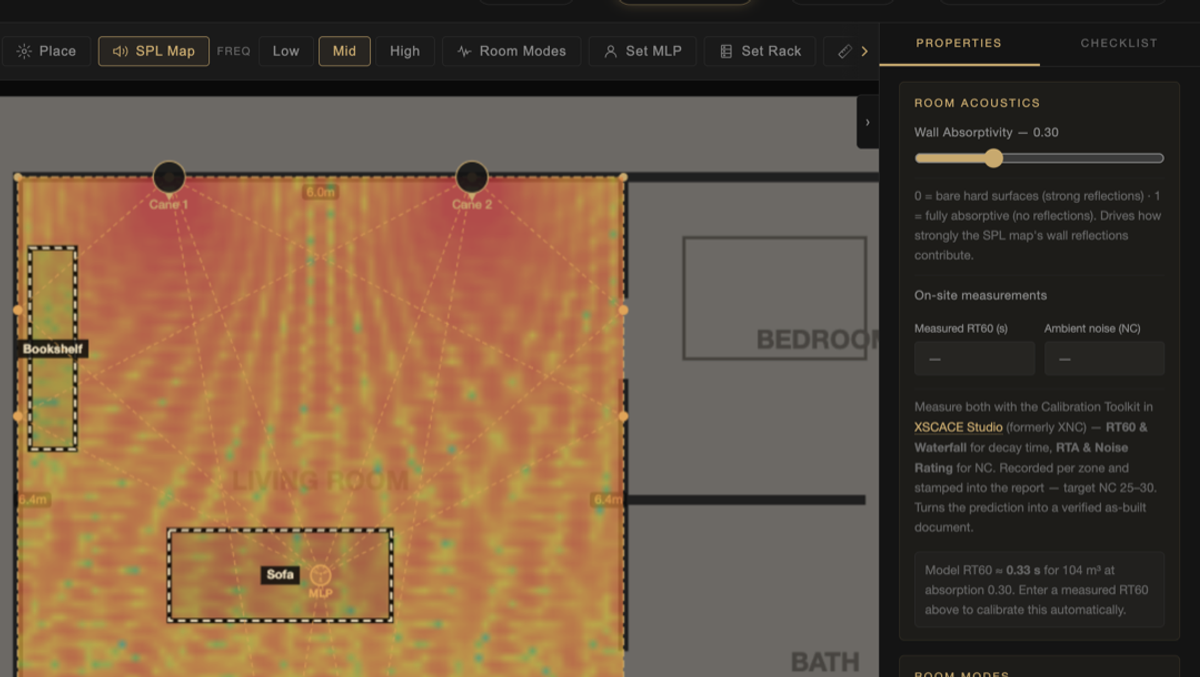
Acoustic panels go in as objects on the plan, and the SPL map recomputes around them. The useful consequence is order of operations: you can test whether treatment actually fixes a problem before it is bought, and see whether moving a speaker would have done the same job for nothing. A panel that changes the map earns its place in the bill of quantities; one that does not can come out of the quote.
It pairs with the measured route described further down. Set the walls from what the room is made of, place the treatment, and the prediction stands on stated assumptions — then enter a measured RT60 after commissioning and the same model re-solves against what the finished room actually did.
One Project, Every Zone
A project in the tool is structured Floors → Zones, not room-by-room. A whole villa, apartment or commercial fit-out is one file: each floor gets its own uploaded plan image and its own real-world scale, and each zone within that floor gets its own SPL map, room mode analysis, reflection points and speaker schedule. The bill of quantities and the PDF report don't stop at one room — they roll every zone on every floor into one set of project-wide totals, with one report section per zone. That matters for the actual use case: nobody specifies a single-room system and stops, and a tool that only simulates one room at a time turns a whole-home proposal into a dozen separate exports stitched together by hand.
Conference Rooms: Intelligibility, Not Just Coverage
A meeting room is not judged on level, it is judged on whether people can be understood. Zones tagged Conference are analysed for speech: STI by the modulation-transfer method of IEC 60268-16, reported against the published bands from bad through poor, fair and good to excellent, alongside Peutz %ALcons and the critical distance.
Microphone coverage is drawn on the plan for seven microphone types, with the working radius taken at the point where direct sound is 6 dB above reverberant. The 3:1 rule checks that microphones are at least three talker-distances apart, and the 4:1 rule checks that loudspeakers sit at least four talker-distances from any microphone, measured in three dimensions rather than on the plan. Gain-before-feedback loss is reported as 10 log of the number of open microphones, and automatic mixing is recommended from four upward.
Distributed ceiling layouts are laid out from the coverage circle on the listening plane at three spacings — edge to edge, minimum overlap, and centre to centre. Set up this room lays minimum overlap first and re-lays to centre-to-centre if uniformity is still worse than 6 dB, which follows AVIXA A103.01 practice. These are estimates and labelled as such: a full IEC 60268-16 STI needs measured impulse responses.
Where It Fits In A Job
The simulator does not replace your survey, your electrician or your ears. It replaces the part of the job where a design lives in your head and has to become a defensible document — and it removes the retyping between the design and the paperwork.
| Stage of the job | Usually done by | What changes |
|---|---|---|
| Site survey / plan | Floor plan from the architect or a measure-up | Unchanged — you still need a plan and a scale reference |
| Speaker count | Rule of thumb, e.g. one per 15m² | Quantities follow a coverage prediction you can show |
| Client presentation | Renders, or "trust me" | Coverage maps, 3D view and a branded report |
| Bill of quantities | Spreadsheet, retyped each revision | Built from the design; a revision is one action |
| Quotation | Second spreadsheet with prices | Excel export round-trips, or a saved price list applies |
| Install pack | Marked-up PDF, verbal handover | Per-zone plans, signal flow, rack layout, cable lengths |
| Commissioning | By ear, or a separate measurement rig | Measure in XSCACE Studio, feed RT60/NC back into the report |
The stage most integrators underestimate is the last one. A prediction is a prediction until somebody measures the finished room. Enter a measured RT60 and ambient noise figure from XSCACE Studio and the simulation is mathematically re-driven by real data — the same document then becomes an as-built record rather than a sales artefact.
Stereo Imaging, Checked Against the 45–60° Target
Coverage tells you the room is loud enough. It does not tell you the stereo image will hold together. With the listening position set, the tool draws the triangle from the left and right speakers to the seat and reports the subtended angle, checked against the 45–60° window that stereo imaging depends on. Green means the geometry works. Amber means the pair is too narrow or too wide and either the speakers or the seat needs to move — a problem far cheaper to find on a plan than after the brackets are in.
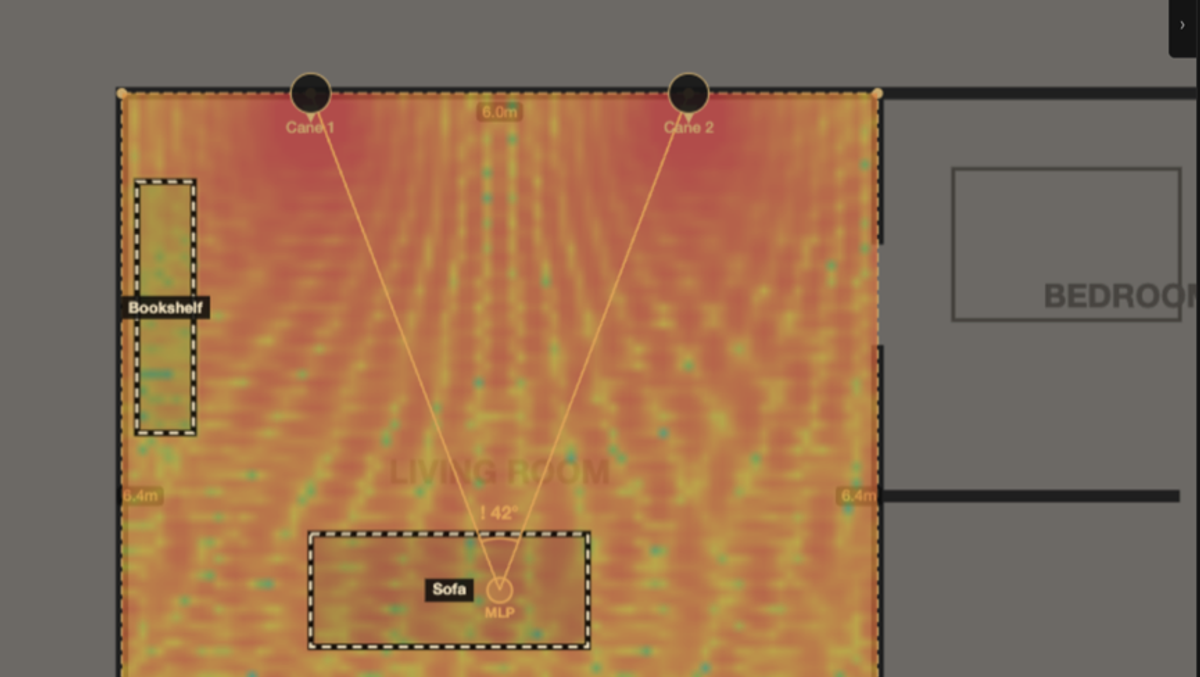
The same listening position drives the first-reflection finder, which draws where early energy bounces off each wall on its way to the seat. Those points are where absorption actually does something, as opposed to where a panel looks tidy.
AI Assistance That Gives Coordinates, Not Generalities
The tool reads the uploaded floor plan and detects furniture — sofas, beds, wardrobes, rugs — automatically, then factors those objects into the acoustic simulation as real absorbers and reflectors rather than leaving the room empty. On top of that, an AI acoustic-treatment pass reviews the actual speaker positions, the listening position, and the room's reflection geometry, and returns specific, buildable recommendations.
A real example from a 6.4m × 6m stereo room: “Right side wall at x=6m, y=2.37m and y=1.32m (ear height ~1.1–1.3m above floor) — two 60×60cm broadband absorption panels,” and “Rear left corner at x=0–0.5m, y=5.7–6.4m, floor-to-ceiling — vertical corner bass trap.” That is a materials list with coordinates, not a suggestion to “add some acoustic panels somewhere.” The same AI layer suggests amplification and streaming source — Air Mini, Air Amp, or a Xylem DSP amplifier — following XSCACE's real wiring rules, including using a placed Acacia Powered subwoofer's own 2-channel speaker outputs as the zone's amplifier where that's the correct call.
Home Cinema: Dolby Reference Angles, Checked Speaker by Speaker
Stereo imaging is a two-speaker problem. A home cinema is a geometry problem with eleven or more solutions, and the reference angles that define it are published — which means a layout can be checked rather than argued about. Place the speakers and the sound simulation software reads the layout, resolves whether it is 5.1, 7.1 or Atmos on its own, and overlays the Dolby reference wedges for the front stage, the side and rear surrounds and the height layer.
Set Screen fixes the screen direction so every angle is measured from the axis that actually matters. Each surround gets a tick when it lands inside its wedge, so a layout is either in specification or it is visibly not — no interpretation. A Phantom Centre option models the centre image the left and right pair forms on its own, and the seat zone across which that image holds together, which is the honest way to show a client what they lose by leaving the centre channel out.
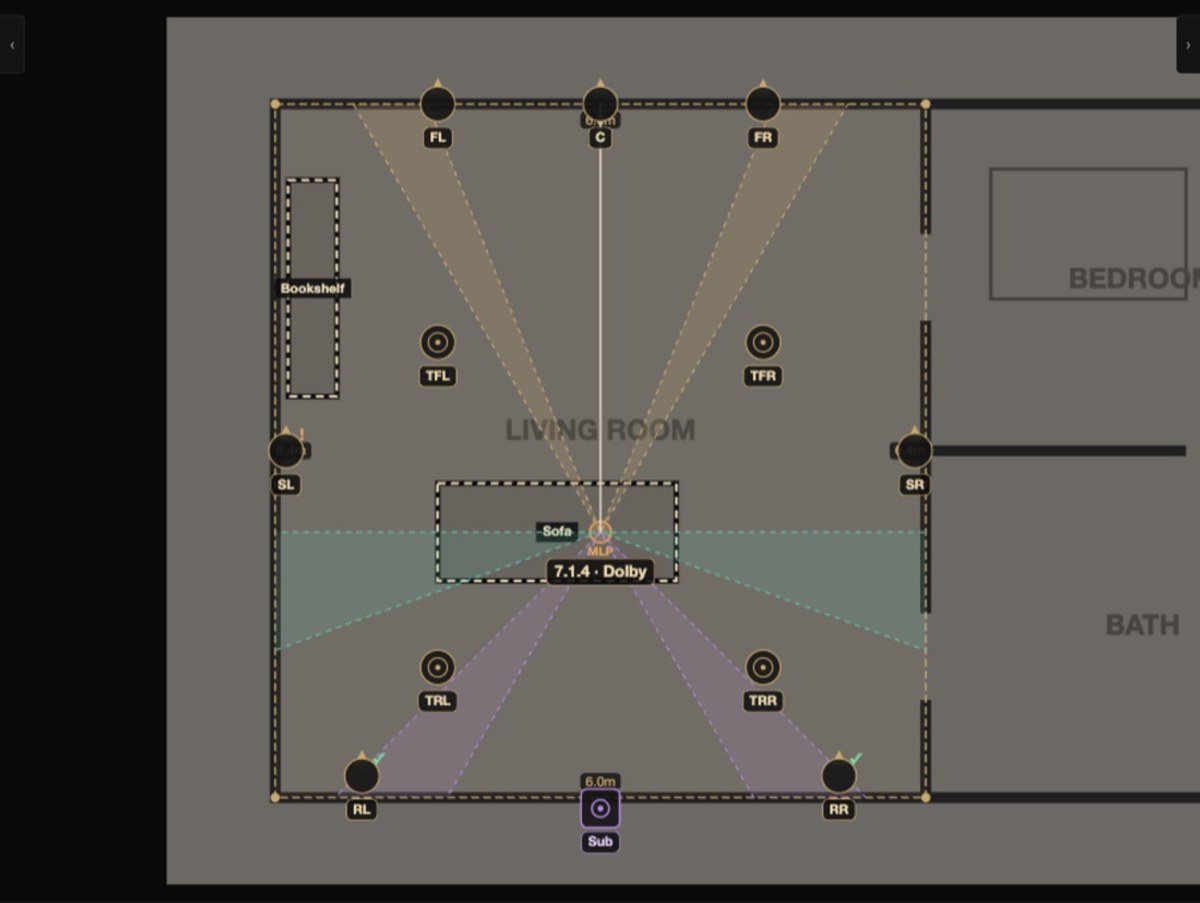
| Layer | What is drawn | What is checked |
|---|---|---|
| Front stage | L / C / R wedges from the seat | Each within its reference window |
| Side surrounds | Left and right side wedges | Angle from the screen axis |
| Rear surrounds | Rear left and right wedges | Present and in spec for 7.1 and up |
| Height layer | Top front and top rear wedges | Elevation and plan angle together |
| Phantom centre | Modelled centre image and its seat zone | Where the image holds without a centre speaker |
The RP22 Design Check, Printed With Every Cinema
The angle overlay is what you see on screen; the design check is what the client receives. Every cinema zone is measured against CEDIA/CTA RP22, the immersive audio design recommended practice, across as many as seventeen rows — only the checks that apply to the room are printed, so a 5.1 lounge gets fewer than a 7.2.4 with wides. The full set covers seating and screen, front left and right, wides, surrounds, rear surrounds, the height layer, speaker aiming, screen transparency, seat-to-rear-wall clearance, bed-layer height, level headroom, low-frequency design, LFE headroom, background noise, reverberation, first reflections and calibration.
Each row states three things: what the practice asks for, what this design actually does, and a status — met, needs review, or settled on site. Level headroom is checked at every seat against roughly 105 dB peak per channel, which is the 85 dB reference plus 20 dB, and the worst seat sets the verdict rather than the main one. LFE is checked against about 115 dB, the same reference plus the 10 dB LFE gain.
Viewing angle sits outside RP22 and is checked separately against the published thresholds: SMPTE and ITU put the minimum at 30 degrees, THX references 36 degrees, CEDIA/CTA-CEB23 asks 43 degrees for 2.35:1 film, and AVIXA DISCAS expresses the same decision as distance-to-image-height ratios. The figures are applied as published; the clause text is not reproduced.
The point of printing it is not to claim a pass. Most rooms come back with several rows needing review, and that is the useful output — it tells the integrator which compromises the architecture has already forced, before anyone is on site.
Two things about the document are worth knowing before quoting it at anyone. RP22 defines twenty-one performance parameters, and the design intent is that you predict them at design and then test and verify them before sign-off — prediction and commissioning are both inside the practice, which is why no honest tool claims to replace the measurement. It also grades to four performance levels rather than a pass or a fail: Level 1 conveys basic artistic intent, and Level 4 reaches performance that often exceeds a commercial cinema.
The planner applies RP22's published figures and prints the rows. It does not assign one of those four levels, and the report says so at the foot of the page: RP22 is a CEDIA/CTA publication, and the licensed text is where the full practice and its performance levels live. Claiming a level from a prediction alone would be exactly the overreach the practice was written to stop.
One Speaker at a Time
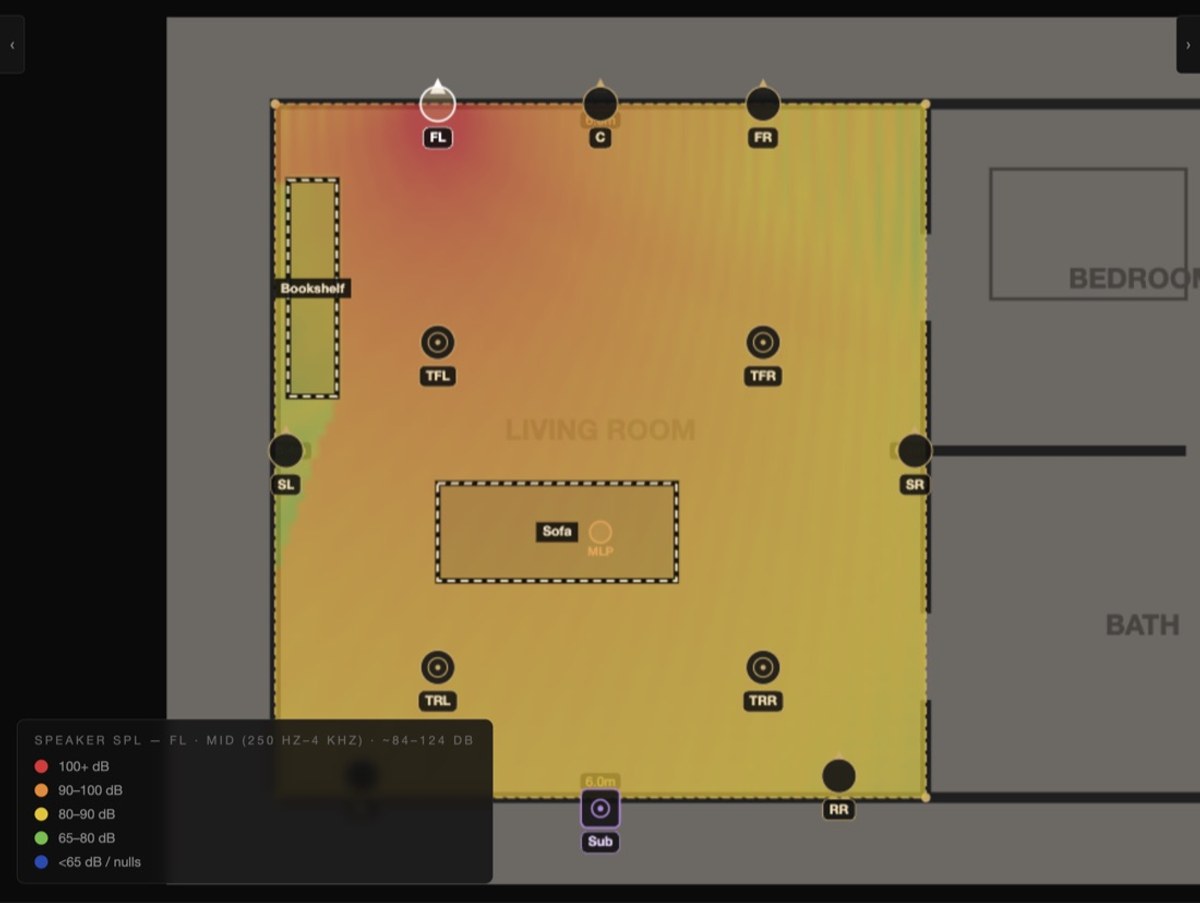
The combined coverage map answers what the room sounds like. It does not answer which speaker is responsible. Speaker SPL renders the predicted field from a single selected speaker on its own — the fastest way to prove a channel reaches the seat, or to find the one driver working harder than the rest of the array. It is mutually exclusive with the combined map, so the picture is never ambiguous about which speakers it is showing.
Two things fall out of that in practice:
A surround that looks fine in the summed map can be twelve decibels down at the seat once it is isolated — usually a mounting height or an aiming problem, not a product problem.
A drive-power slider runs each speaker anywhere from zero watts to its rated power, and the predicted level moves with it — so the question stops being whether a speaker is loud enough and becomes how much amplifier it needs to be.
A Worked Example
The sample report bundled with this guide is a real generated project rather than a mock-up: two floors, four zones, eleven speakers and sixteen line items in total, including electronics. It is worth looking at because it shows the shape of what a client actually receives.
The PDF is not the only way out. The same project publishes to a private web page — the client link — which is usually the better thing to send, because it is interactive where the document is flat. This is a live one: six rooms across three storeys, 42 speakers, 179 m² covered. It opens on the whole system, then gives each room its own page with a 3D model the client can orbit and walk through, switching between floor coverage, the low, mid and high bands, interference, seats and reflections. The bill of quantities is grouped by room with unit prices reading "On request" until you publish them, and a Leave a note button files the client's comment against the room they are looking at rather than in an email thread.
| Product | Series | Power | Qty |
|---|---|---|---|
| Cane | Slim Array | 50W | 2 |
| Quad Cane | Slim Array | 100W | 2 |
| Bonsai In-Ceiling/Wall | In-Ceiling | 40W | 1 |
| Camphor 6 | Outdoor | 70W | 2 |
| Acacia 10 Powered | Slim Sub | 300W | 2 |
| Acacia 6 Powered | Slim Sub | 200W | 1 |
| Juniper | Powered Sub | 350W | 1 |
| Air Mini | Streamer | — | 2 |
| Air Amp | Streaming Amplifier | 80W | 1 |
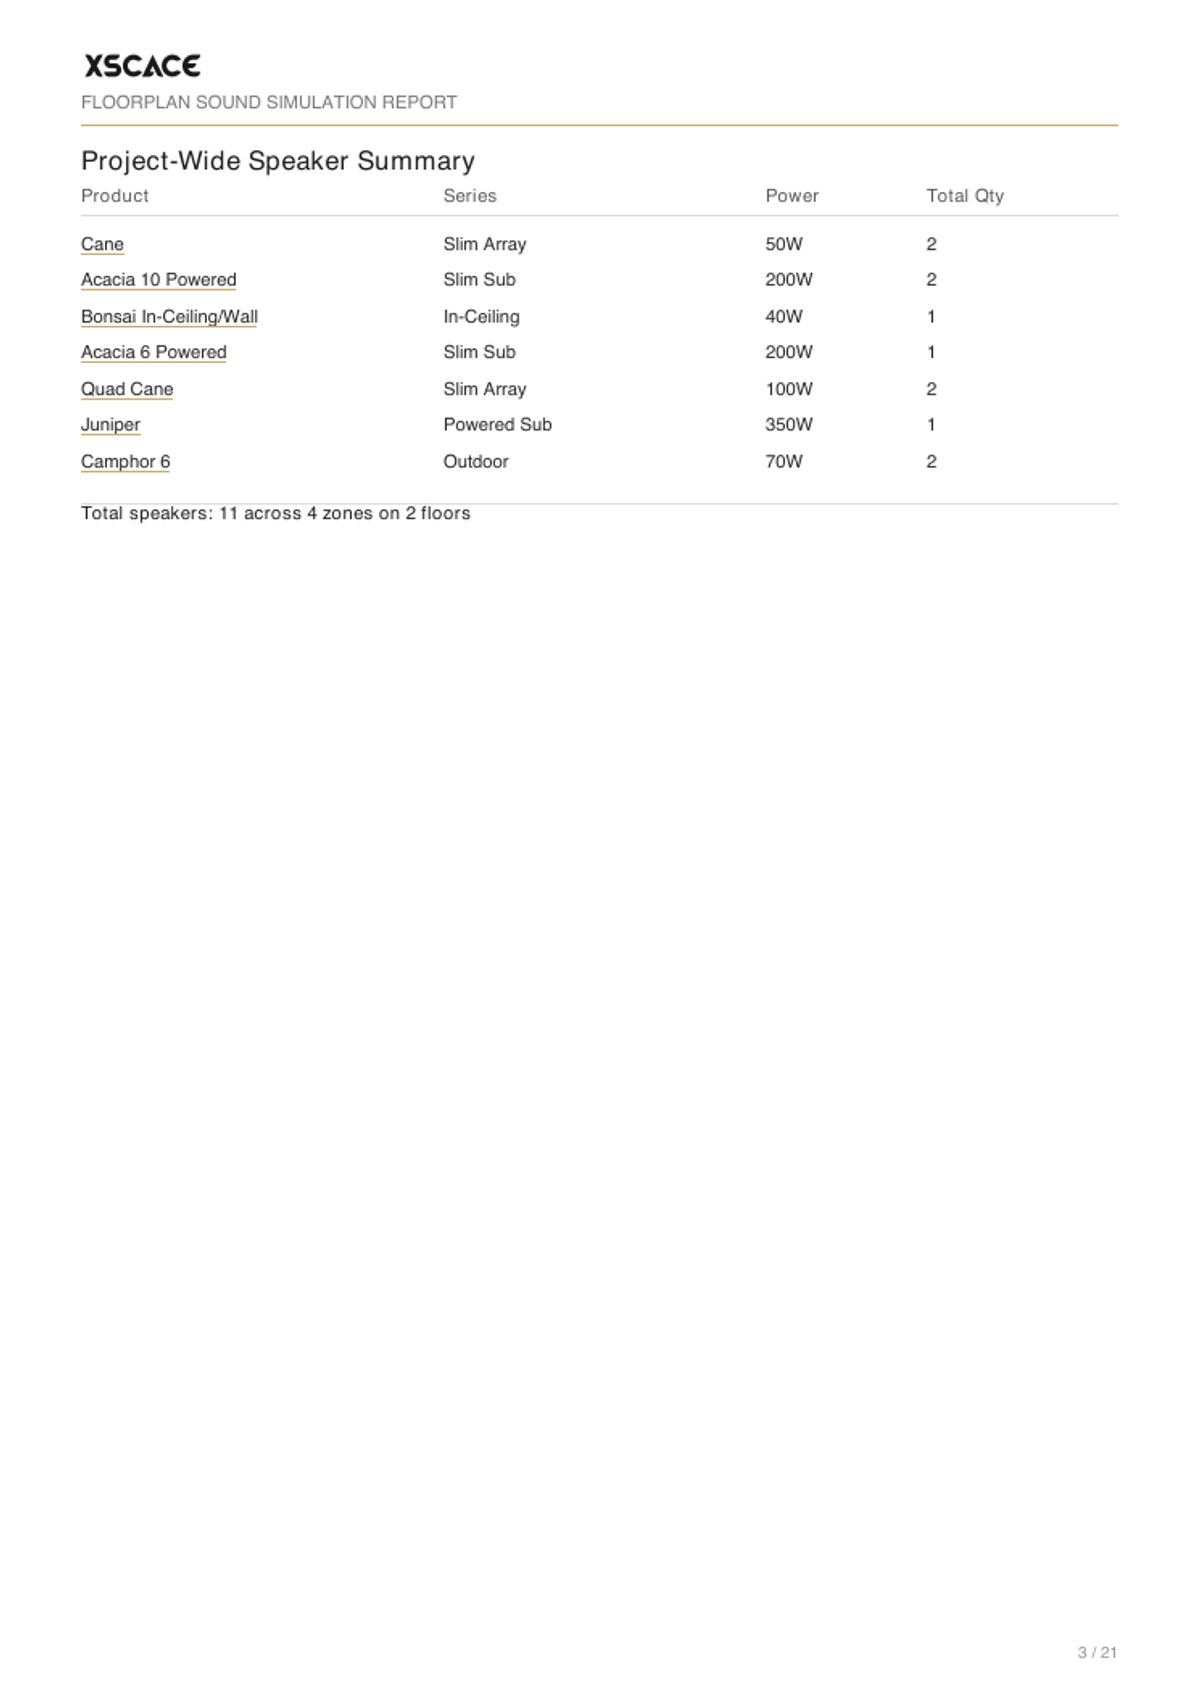
Two things in that list matter to an integrator. First, the summary is project-wide but the schedule underneath it is per zone, so you can answer "what goes in the media room" without recounting. Second, streamers and amplifiers appear as line items alongside the speakers — the electronics are part of the bill of quantities rather than an afterthought added by hand at quoting time.
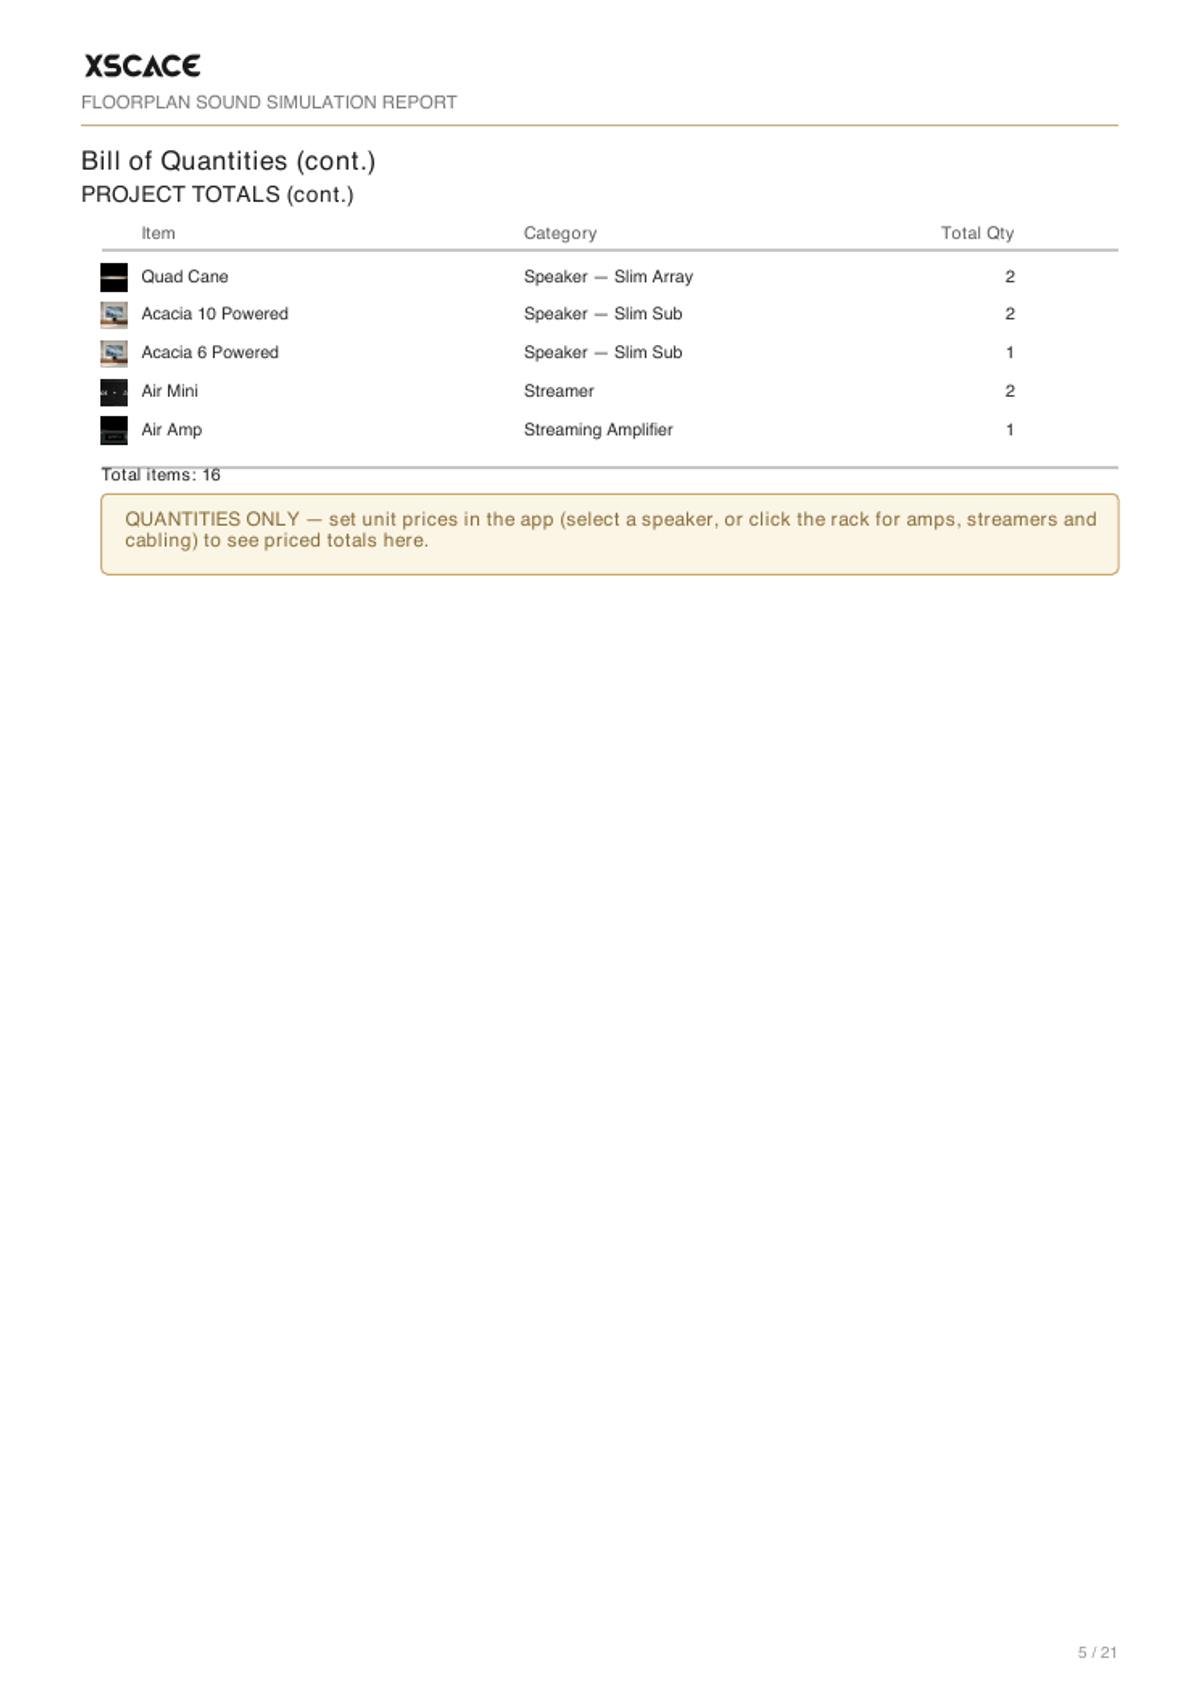
The report is explicit about what it is not: without unit prices set, it prints quantities only and says so on the page. That is deliberate — a quantities document that silently shows zero prices is worse than one that tells the reader prices have not been applied yet.
Designing With Other Manufacturers’ Products
The XSCACE catalogue is built in with real published specifications — Slim Array, in-ceiling, in-wall, outdoor and subwoofers, plus streamers, amplifiers and processors. But real projects mix brands, and a design tool that only knows one catalogue is a brochure. Alongside the XSCACE range it now carries soundbars, their companion subwoofers and other manufacturers' products, filterable by brand, so most mixed-brand jobs can be specified without adding anything at all.
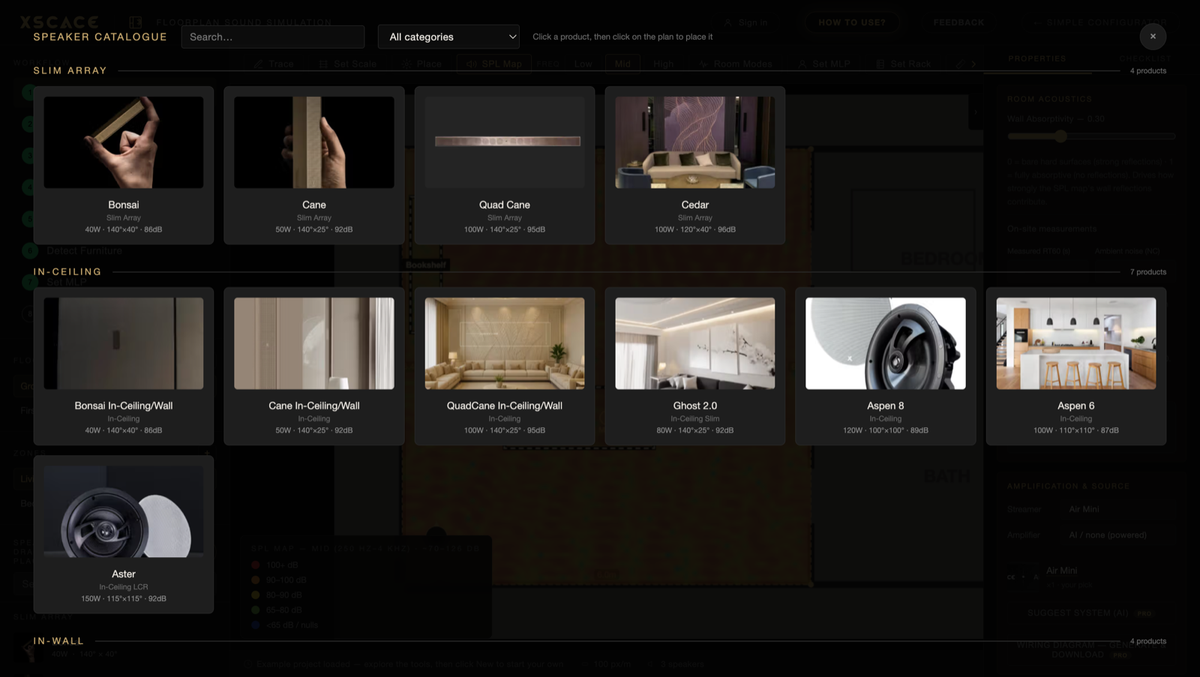
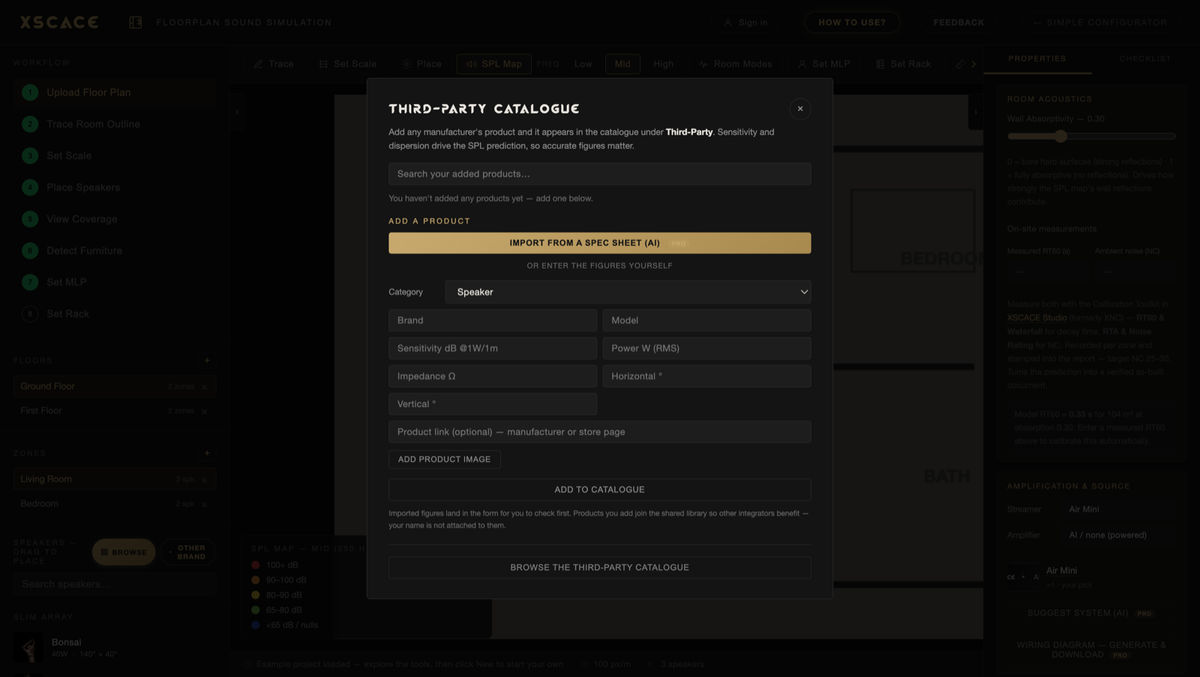
With Pro you can add any manufacturer’s product two ways: type in the sensitivity, power and dispersion by hand, or upload the spec sheet and let the AI extract them. Added products join a shared community catalogue, so the library improves for everyone using the tool rather than staying locked to one account.
Design It, Then Prove It
A prediction is only as good as the assumptions behind it, and the tool doesn't pretend otherwise. Every zone has a Room Acoustics panel for on-site measurements — a measured RT60 (reverberation time) and ambient noise (NC), taken with the Calibration Toolkit built into the XSCACE Studio. Enter that real RT60 reading, and it's mathematically inverted (Eyring) into the room's true average absorption, which then re-drives the entire simulation — the model stops guessing at wall absorptivity and starts using what the room actually measured. The result gets stamped into the report alongside the prediction, so what a client receives is a verified as-built document, not just a forecast. This is the one thing the tool is explicit about not claiming: it does not replace on-site measurement. It becomes accurate once you take one.
3D, and the Paperwork That Wins the Job
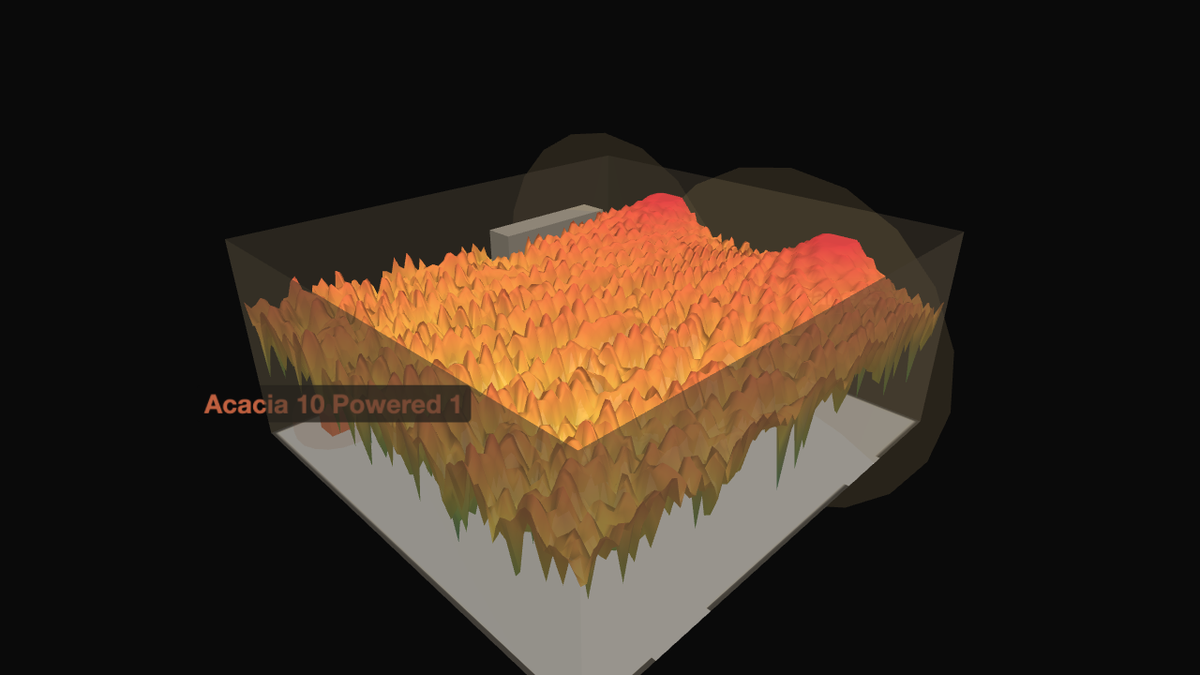
The same SPL prediction renders as a full 3D waterfall relief surface — speaker dispersion cones, reflection rays, room-mode visualisation, SPL beams, Dusk and Gallery looks, shaped ceilings, and a Listen from mode that puts you at each row at seated eye height on its riser. It exports to GLB for use in other 3D software.
But the outcome that actually closes a project is the paperwork: a bill of quantities broken down floor by floor and zone by zone, a branded XSCACE quotation spreadsheet with live line-total and grand-total formulas, and an indexed PDF report with a cover page, a clickable table of contents, one page per zone with its SPL map and technical details, a signal-flow diagram per zone, 3D views, and a phase-based commissioning checklist. An integrator walks into a client meeting with a heat map of the client's actual living room and a priced proposal — not a verbal description of what a system “should” sound like.
What You Actually Hand the Client
A prediction nobody can see is worth very little. The tool’s real output is a client PDF report: a cover, contents, per-zone floor plans with their coverage maps, technical detail, the 3D view, and a full bill of quantities with product images. On Pro it carries your logo rather than ours. A complete report of roughly twenty-one pages lands around 1 MB, because the images are high-quality JPEG and compressed rather than dumped in at full resolution.
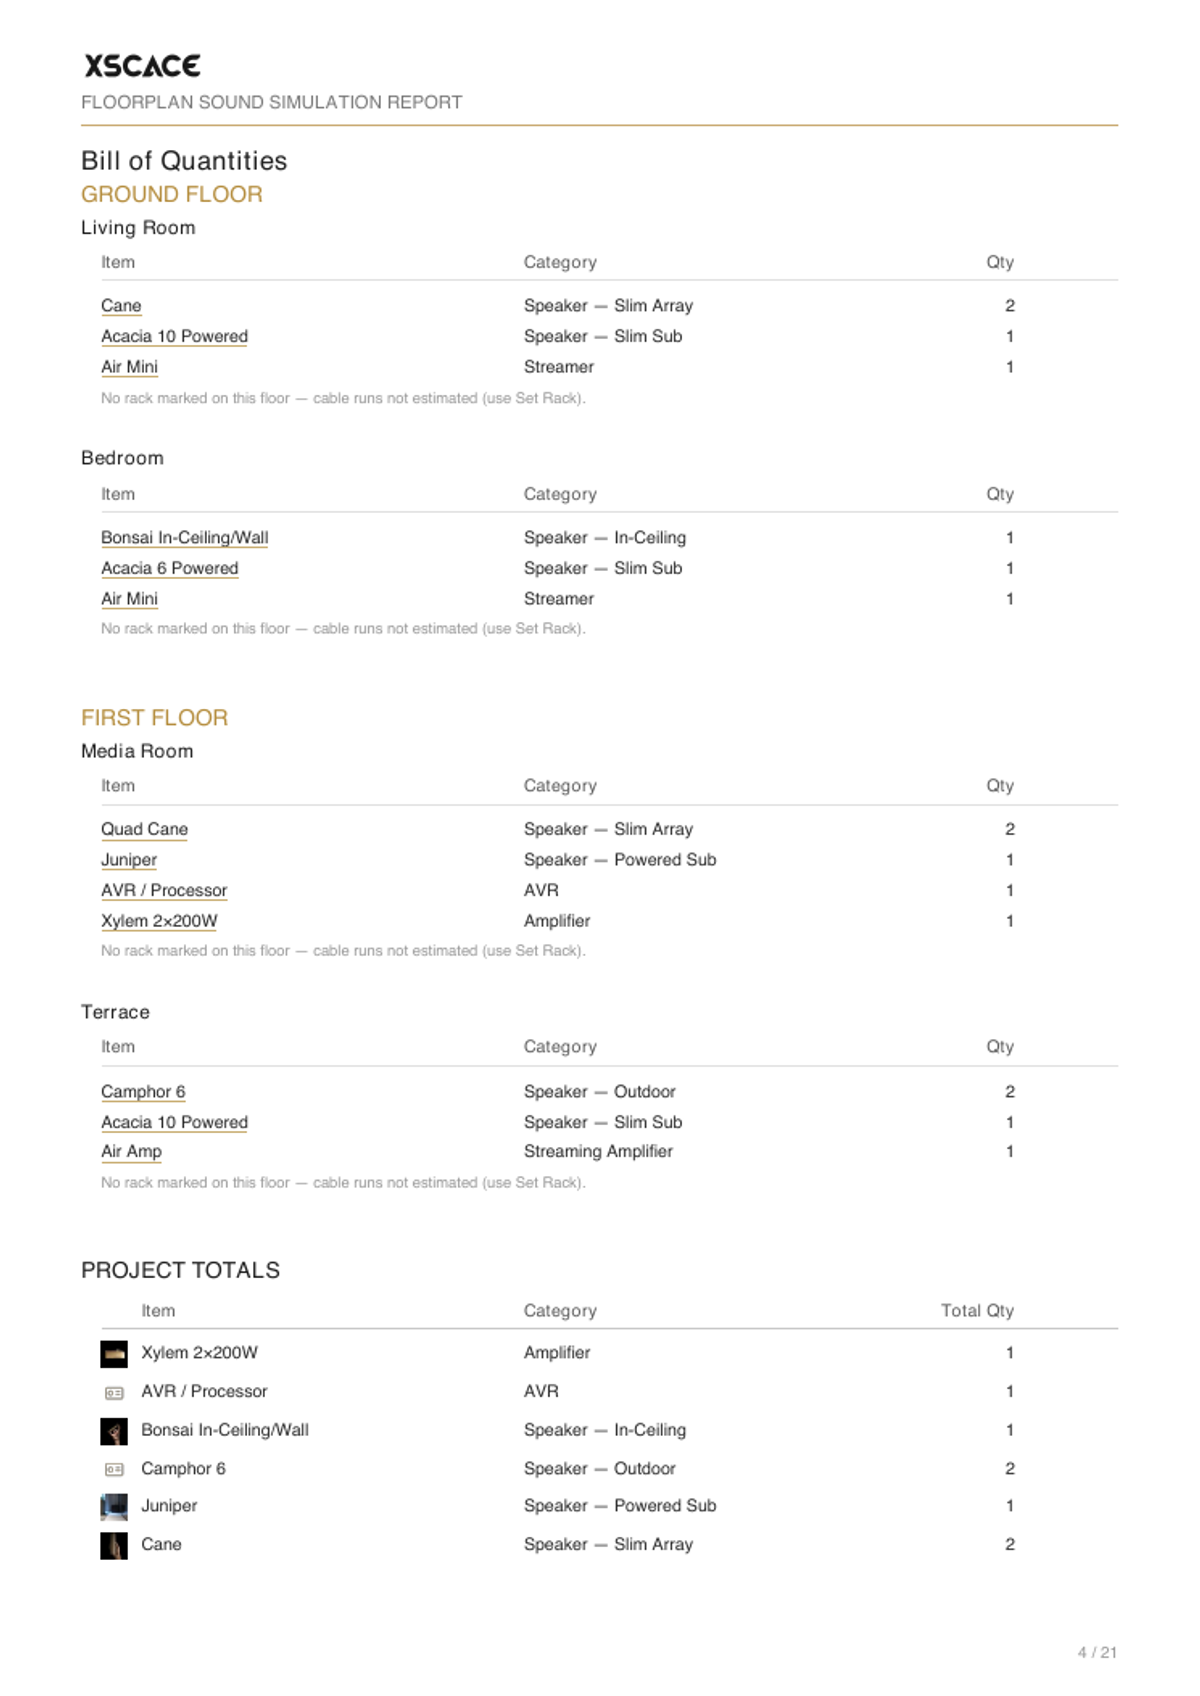
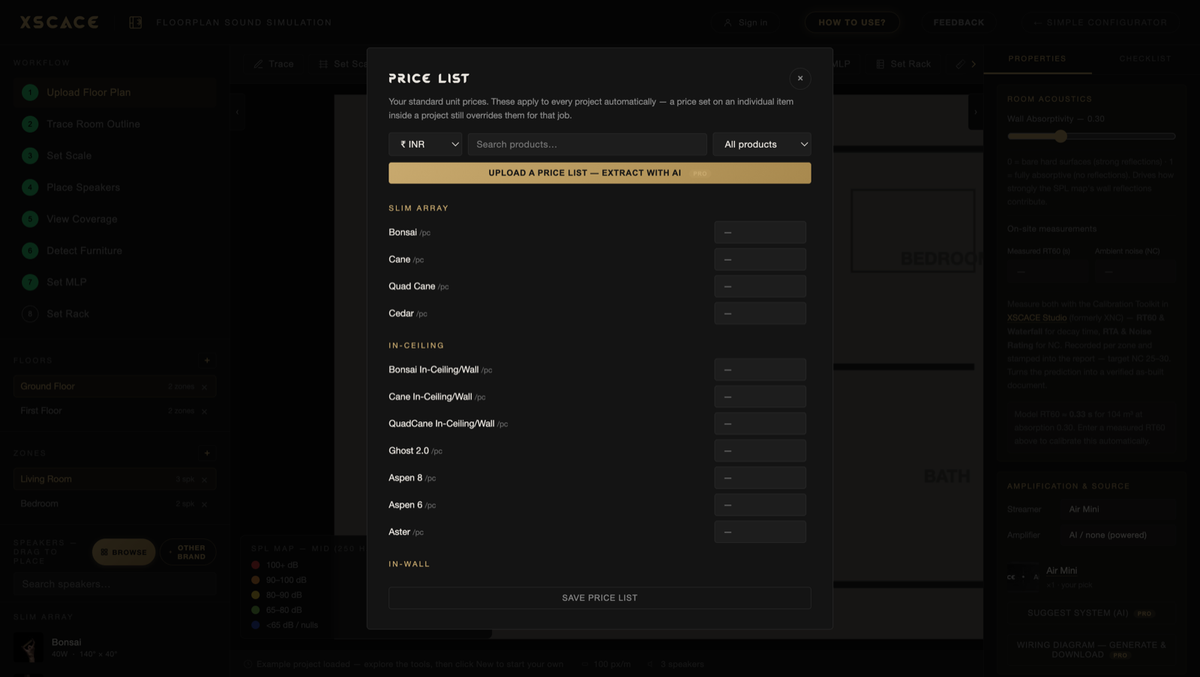
The bill of quantities is assembled as you design rather than typed up afterwards — every speaker, streamer and amplifier, with rack cabling estimated from where you placed the rack. Export it to Excel, fill in your prices and re-import: it round-trips cleanly through a hidden ID column. Or set your prices once as a saved price list and they apply to every project automatically, in any of twelve currencies, shown on the bill of quantities, the report and the spreadsheet alike.
One thing worth being explicit about, because people arrive here looking for it: the price list in the planner is your price list, not an XSCACE one. XSCACE does not publish a public price list or a price list PDF — pricing depends on specification, finish and the installation, and is quoted by your regional distributor. What you save here are your own standard unit prices, applied automatically to your projects. For the XSCACE range and the route to your distributor, see XSCACE products and pricing.
The same screen carries the commercial side of the document, so a bill of quantities becomes a quotation without being retyped into something else. Unit prices take line and order discounts; labour, tax and a round-off sit underneath; and a custom specification column lets you write the wording a client will actually read rather than the catalogue description. Optional lines are priced but held out of the total, which is how an upgrade gets shown without inflating the number the client compares.
Terms and a prepared-by line close it out. The whole thing groups either by room or by category — by room when the client is reading it, since that is how they experience the house, and by category when the installer is ordering from it.
A Report That Knows Whether the Room Is for Music or Cinema
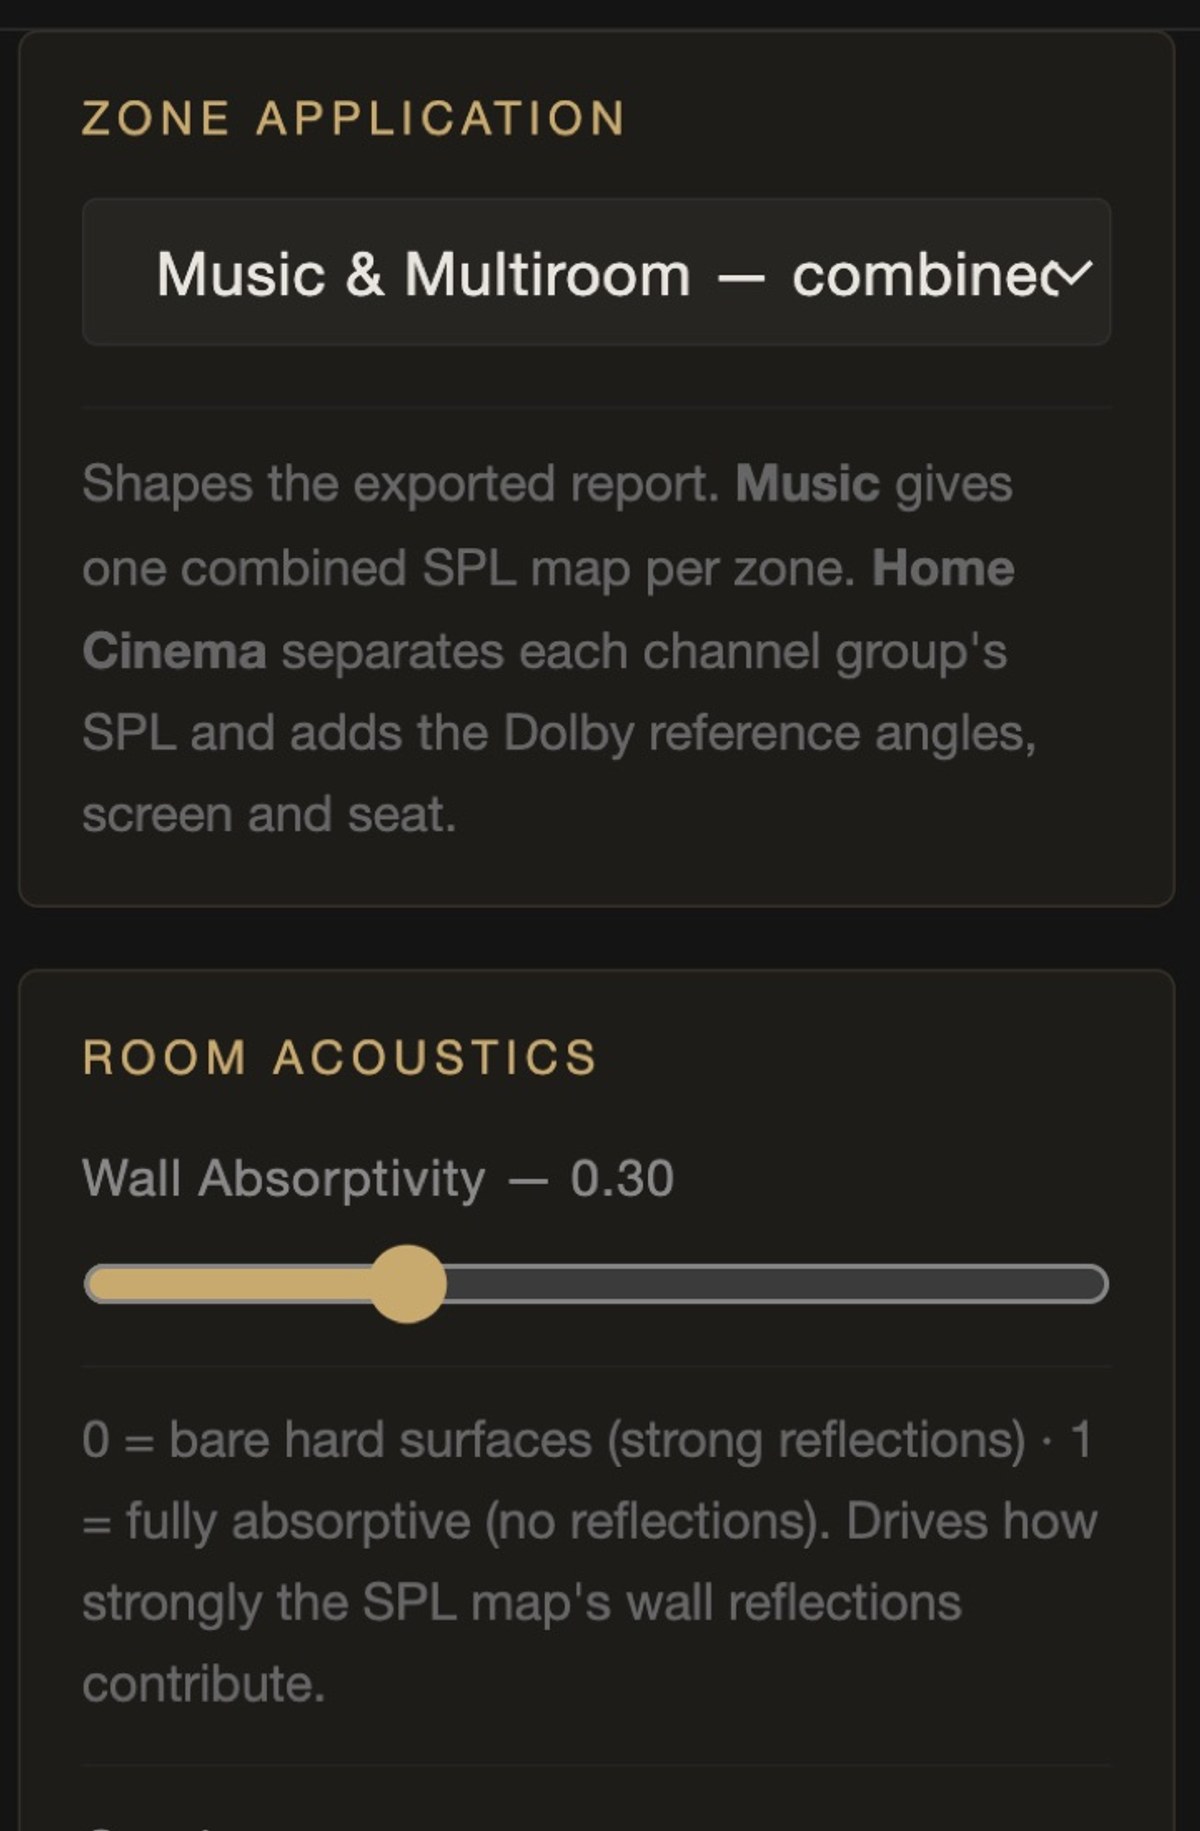
Every zone is tagged as Music & Multiroom or Home Cinema, and that one choice reshapes the exported PDF. The distinction is acoustic, not cosmetic. A stereo pair sums into a single field, so a music room is honestly described by one combined SPL coverage map — rendered across the mid band with the low and high ranges called out, the stereo imaging angle, and the count of first-reflection points near the seat.
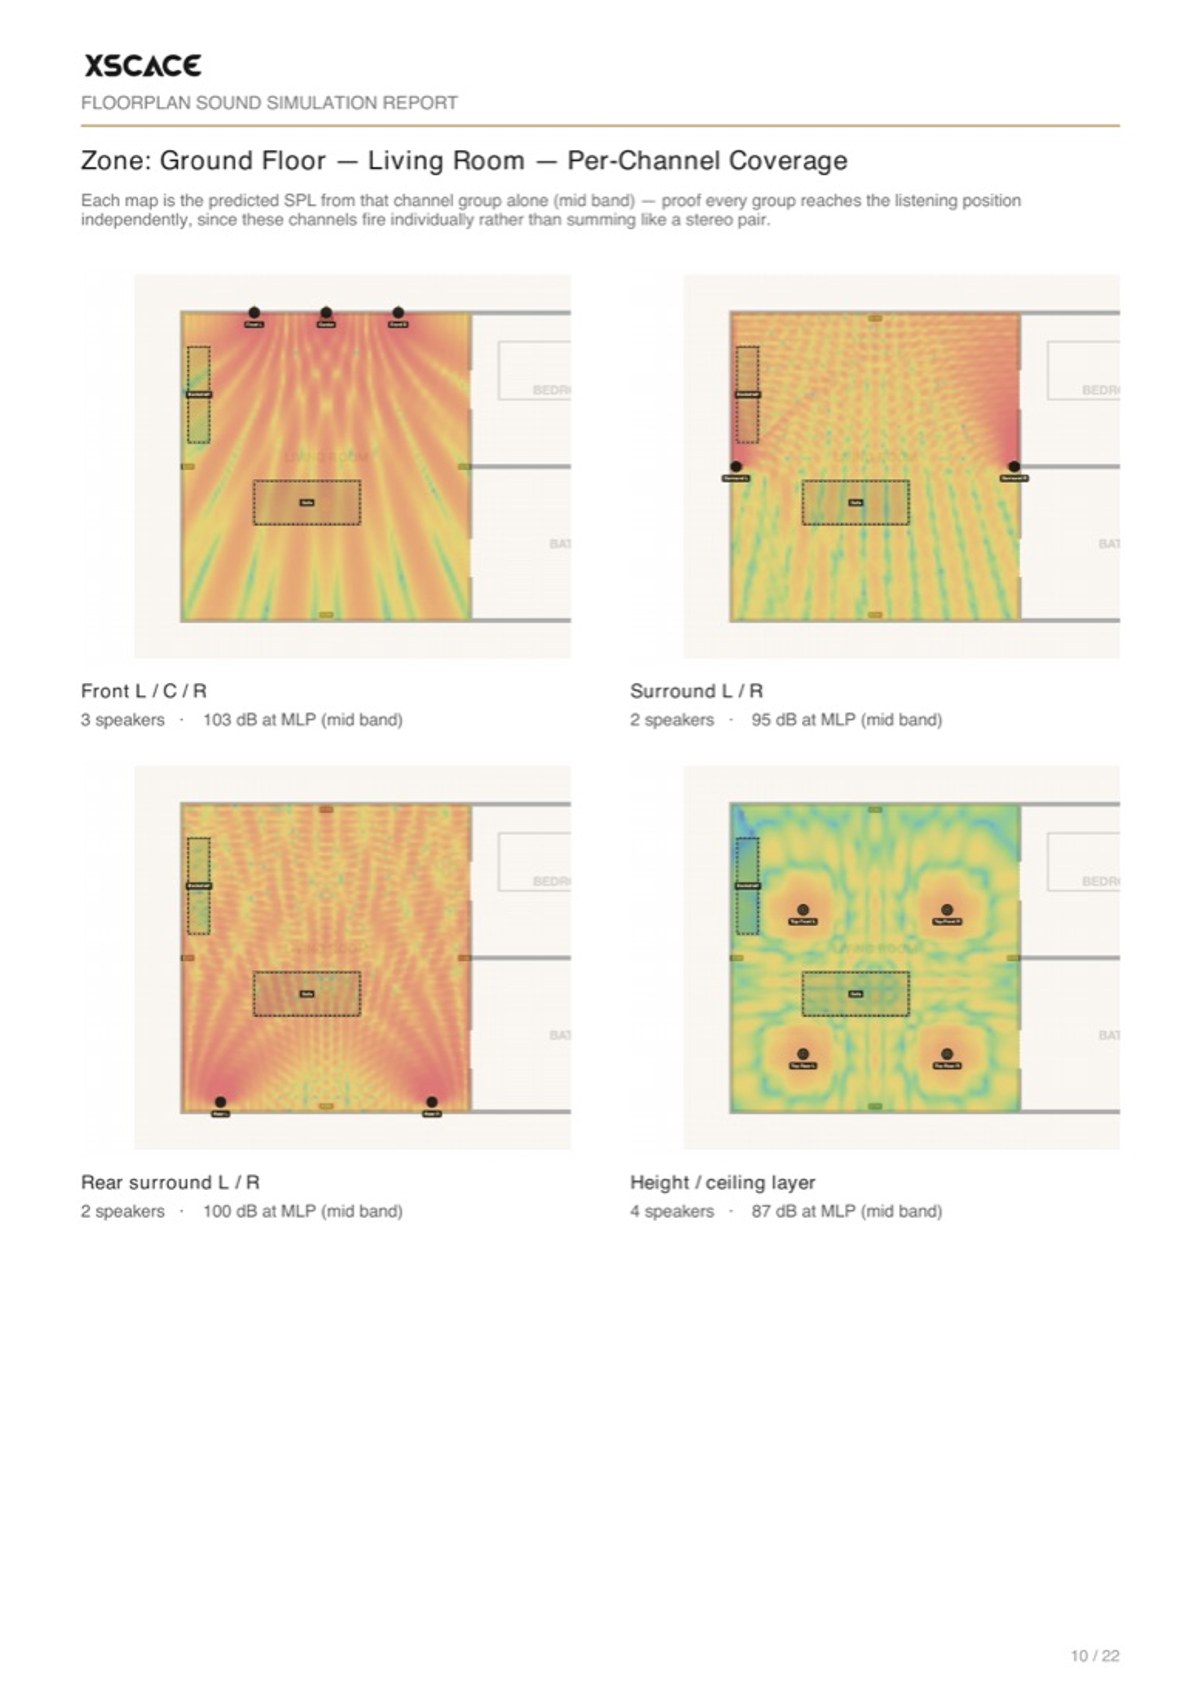
Cinema surrounds and height speakers do not sum that way. They fire individually, and averaging them into one map hides exactly the failure a cinema commissioning argument is about. So a cinema report dedicates a page to each channel group — front L/C/R, the surrounds, the rears, the height layer — each mapped from only its own speakers and annotated with the level it delivers at the main listening position, with the Dolby angles, screen bearing and seat position written in.
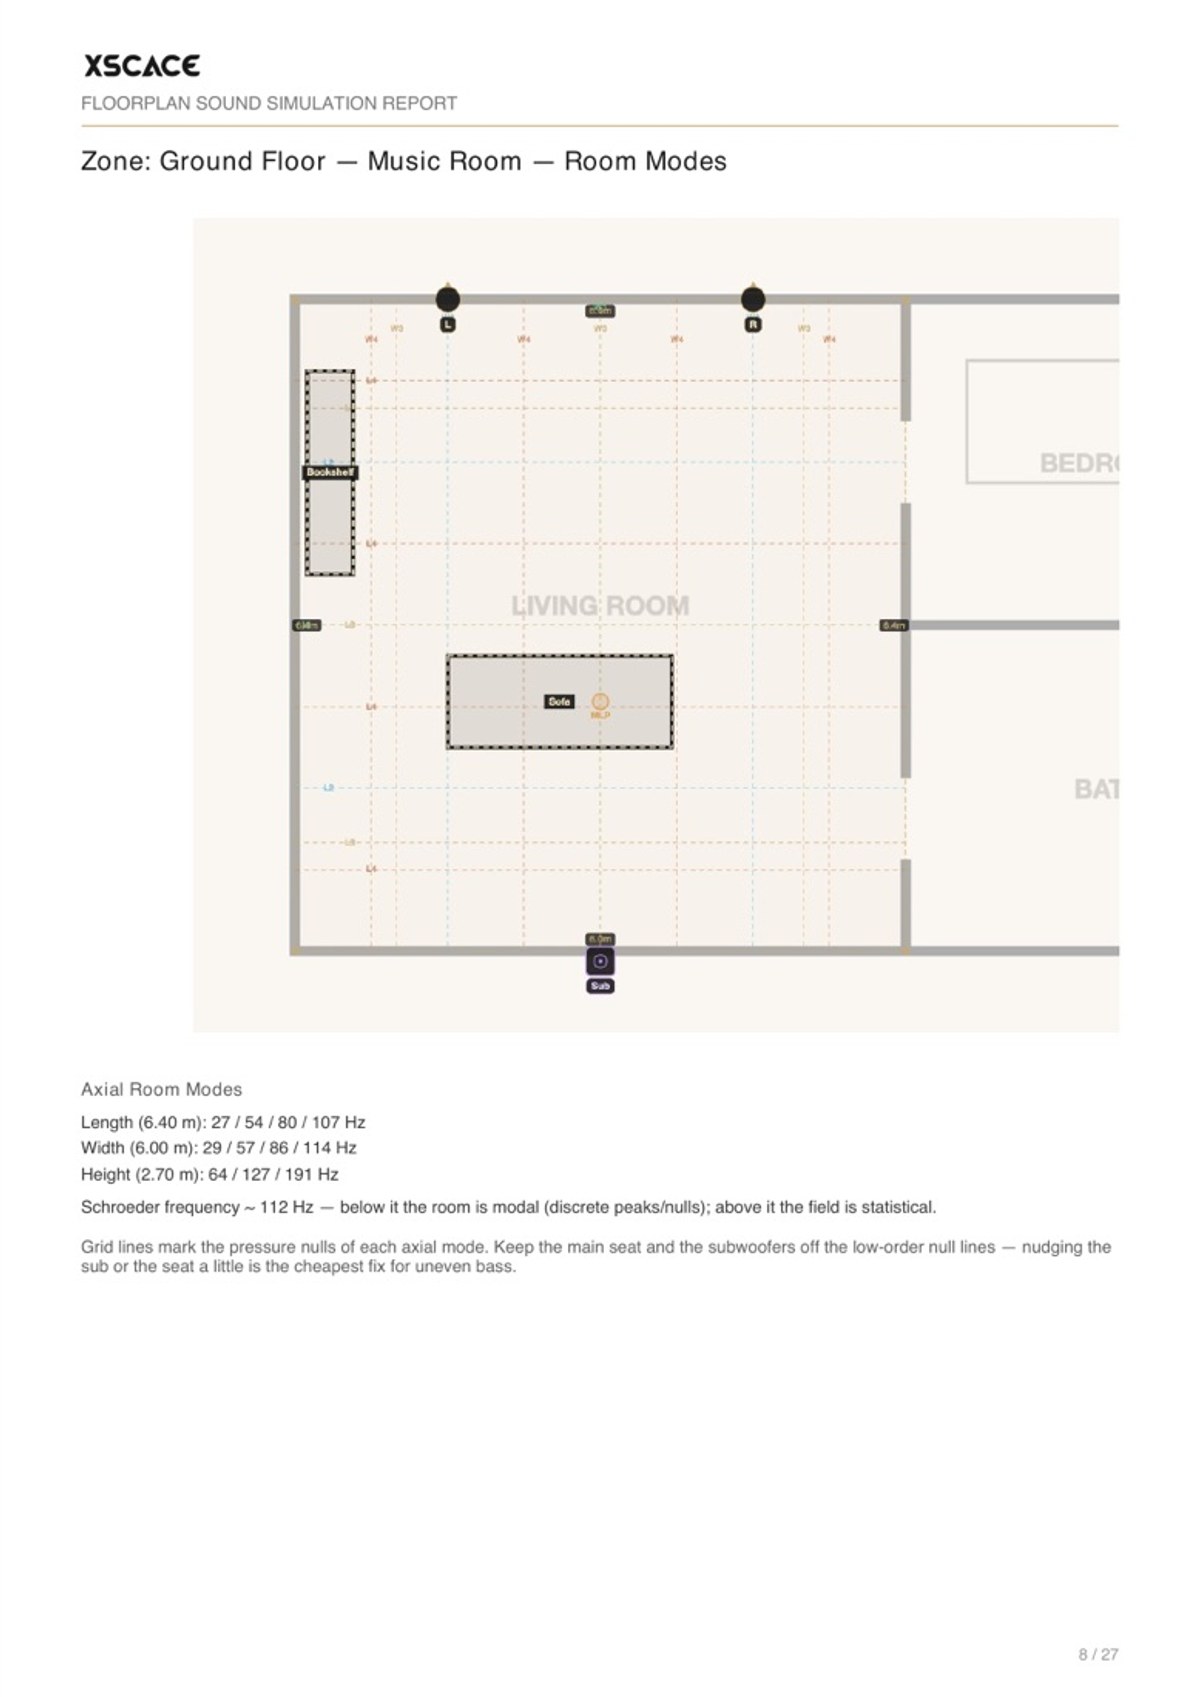
Every zone now also carries a Room Modes page: the axial null-line grid over the plan, the modal frequencies for length, width and height, the Schroeder transition below which the room is modal rather than statistical, and plain-English guidance on where to keep the subwoofer and the seat. That page is the difference between a coverage picture and a document an acoustician will read without wincing.
Several Amplifiers in One Zone
A cinema rarely runs off one amplifier, and until now the tool made you pretend it did. A zone can be driven by as many amplifiers as it needs — a Lucifer 8 for the bed layer and a Lucifer 4 for the heights, each with its own quantity — and every one flows through to the bill of quantities and the signal flow. Powered subwoofers can drive the satellites themselves, using the Acacia 10's two-channel output or the Banyan Pith's mono output.
Defending The Design To A Client
Most of the commercial value here is not the acoustics. It is that the acoustics become showable. Three outputs do the work in a client meeting.
- The coverage map — a heat map on an absolute dB scale across Low, Mid and High bands, which answers "will it be loud enough at the far end" without hand-waving
- The 3D waterfall — the same prediction as a surface you can orbit, which is what people actually lean in to look at
- The stereo imaging angle — the triangle drawn on the plan against the 45–60° target, which turns "the sofa is in the wrong place" from an opinion into geometry
The same three outputs are what protect you later. A client who signed off a coverage map has agreed to a predicted outcome, in writing, before the drywall closed. A variation request after the fact is then a conversation about a documented change rather than a dispute about what was promised.
What It Costs
The design tool is free and needs no account. Simulation, room analysis, the bill of quantities and Excel export all work signed out and autosave in the browser. XSCACE Pro adds the parts that turn it into a quoting workflow, after a 14-day free trial; paying annually gives two months free. Active XSCACE dealers get Pro at no cost.
| Free | XSCACE Pro | Dealer | |
|---|---|---|---|
| Price | $0, no account | $49.99/user/month | Free with active dealership |
| Simulation, room modes, 3D | Yes | Yes | Yes |
| Bill of quantities + Excel | Yes | Yes | Yes |
| Signal-flow & commissioning checklist | Yes | Yes | Yes |
| Client PDF report | 3 per month | Unlimited | Unlimited |
| AI furniture, treatment, system advice | No | Yes | Yes |
| Saved price list + 12 currencies | No | Yes | Yes |
| Cloud projects | No | Yes | Yes |
| Your logo on client reports | No | Yes | Yes |
| Third-party equipment + AI spec import | No | Yes | Paid add-on |
| Monthly AI requests | 25 (8 signed out) | 500 | 500 |
The free tier is deliberately generous on design and tight on AI — it exists to make specifying XSCACE hardware easy, not to hand out an AI budget. When a Pro trial ends nothing is deleted: projects and price lists stay, the Pro features pause, and the free tool carries on.
Which Tier An Integrator Actually Needs
The free tier is deliberately generous on design and tight on AI. Simulation, room analysis, the bill of quantities and Excel export all work signed out — which means you can run a real job through it before deciding anything.
| If you are… | Tier | Why |
|---|---|---|
| Evaluating the tool on a live job | Free | Full simulation, BOQ and Excel — no account, no card |
| Quoting occasionally | Free | Three client PDF reports a month covers light use |
| Quoting weekly, own branding | Pro | Unlimited branded reports, saved price list, cloud projects |
| Mixing brands on most jobs | Pro | Third-party equipment and AI spec-sheet import |
| An active XSCACE dealer | Dealer | Pro at no cost; third-party add-on remains paid |
The honest read on Pro is that it is a business tool rather than an acoustics upgrade. Nothing about the prediction improves when you pay. What you get is your logo on the report, your prices applied automatically, projects in the cloud, other manufacturers in the catalogue, and unlimited reports. If you quote once a month, the free tier is genuinely enough.
The Standards and Methods Behind It
Every figure in the report comes from a named method or a published reference, and it is worth setting them out in one place — partly so an engineer can judge the assumptions, and partly because a number whose derivation you cannot state is a number you should not put in front of a client.
- Channel geometry and viewing — CEDIA/CTA RP22 for the angle and height bands, level and LFE headroom and multi-sub layouts; Dolby reference layouts and ITU-R BS.2159 for multichannel placement; CEDIA/CTA-CEB23 at 43 degrees, THX at 36 and SMPTE/ITU at 30 for viewing angle, with AVIXA DISCAS expressing the same decision as distance-to-image-height ratios.
- Coverage — An image-source model for first-order reflections off every traced wall, the floor, the ceiling and each furniture object, summed as complex phasors at the band centre so real comb filtering appears rather than a smooth blob. AVIXA A103.01 sets the plus or minus 3 dB uniformity target that drives ceiling grid density.
- Reverberation and noise — Eyring rather than Sabine, because Sabine overstates decay in a well-damped room, with the same equation inverted when a measured RT60 is entered. Panel coefficients follow ASTM C423 style published data, extended by the quarter-wave rule for depth and air gap. Background noise converts from NC to dBA as NC plus 5, after ANSI S12.2 and Beranek.
- Bass — Every axial, tangential and oblique eigenmode to 200 Hz, with rigid-wall cosine mode shapes carrying Kuttruff normalisation, each mode damped by the absorption of the surfaces it engages. The traced polygon is reduced to a best-fit rectangle by convex hull, and the fill ratio is reported so the approximation is visible.
- Speech — STI by the Houtgast and Steeneken modulation-transfer method of IEC 60268-16, averaged over fourteen modulation frequencies from 0.63 to 12.5 Hz, reported with the published qualification bands. Peutz supplies %ALcons and the critical-distance term for n loudspeakers. The 3:1 and 4:1 microphone rules and 10 log of the number of open microphones handle the microphone side.
- 3D and cabling — The iso-surface shell is marching cubes over a true volumetric SPL field rather than an extruded two-dimensional map. Cable gauge comes from a half-decibel loss limit by length and impedance, and any HDMI run past twelve metres is pulled as Cat with an extender pair, following HDBaseT practice.
Standards are applied as published figures; clause text is not reproduced, and RP22 in particular is a licensed CEDIA/CTA document whose full practice and four performance levels live in the original. Everything above predicts. What settles it is a microphone in the finished room.
What It Does Not Do
Worth stating plainly, because a tool that claims everything is harder to trust on the things it does do.
- It models axial, tangential and oblique room modes to 200 Hz from the traced geometry — but it is not a full wave solve
- Absorption is set per wall, plus the panels you place and any detected furniture — an absorptivity model rather than a frequency-by-frequency material schedule
- It predicts. It does not measure. Only a microphone in the finished room does that
- It knows its own catalogue plus any third-party products you add — it is not a universal product database
- It covers the audio scope. It is not construction estimating software for a whole building
None of that stops it being the fastest route from a floor plan to a defensible quote. It does mean the output is a prediction with stated assumptions, which is exactly what a specification should be until it is commissioned.
Floorplan Sound Simulation at a Glance
- Free browser-based tool — no install, no account required to design
- Twenty-one guided steps from floor plan upload to the priced bill of quantities, autosaving throughout
- SPL coverage across Low (20–250Hz), Mid (250Hz–4kHz) and High (4–20kHz) bands
- Axial, tangential and oblique room modes to 200 Hz, first reflections, and stereo imaging checked against 45–60°
- Every wall built in layers with its real thickness and per-band finishes, with acoustic panels and structures placed as objects
- Speaker SPL to render the field from one selected speaker on its own
- Home cinema layouts resolved as 5.1, 7.1 or Atmos and checked against the Dolby reference wedges, with every channel auto-labelled
- 3D waterfall view with dispersion cones, walk-through mode and GLB export
- AI furniture detection, acoustic treatment advice and system suggestions (Pro)
- Any manufacturer’s product via manual entry or AI spec-sheet import (Pro)
- Bill of quantities per floor and zone, Excel round-trip, twelve currencies
- More than one amplifier per zone, each flowing into the bill of quantities and the signal flow
- Client PDF report with your branding — roughly 21 pages at about 1 MB
- Report shape follows the zone — one combined map for music, a page per channel group for cinema
- Enter a measured RT60 and NC from XSCACE Studio to make it an as-built document
The tool is live now, free, and open at xscace.com/software/floorplan-sound-simulation, where every speaker in the placement catalogue links back to its real product page and full specification sheet. For a shorter walkthrough of the same workflow, read from floor plan to quote in one afternoon; for the commercial side on its own, how to create an audio BOQ.